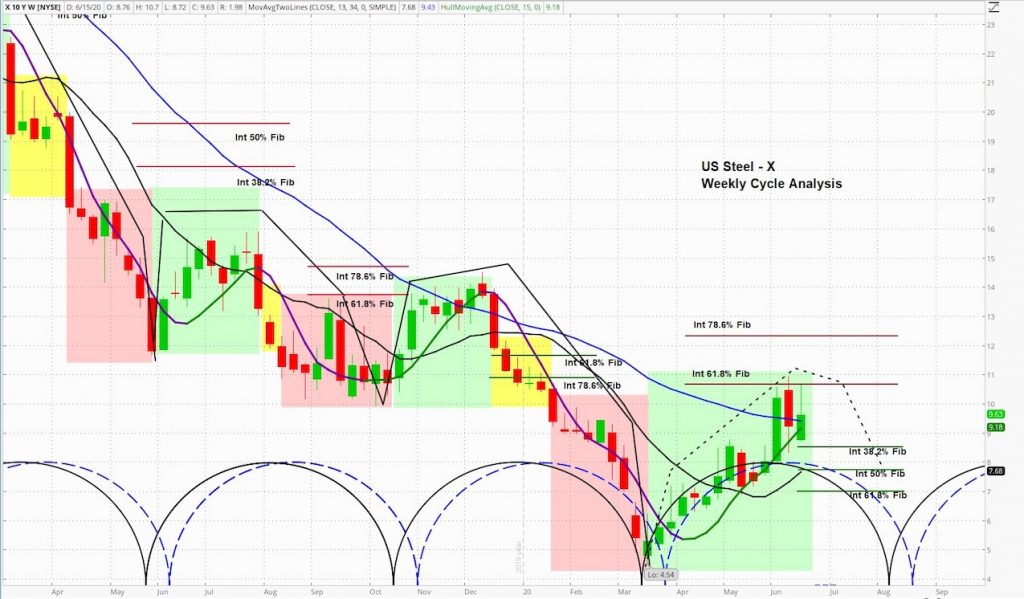
US Steel (X) Weekly Cycle Analysis
On Wednesday, US Steel NYSE: X announced that it expects to post an adjusted loss of $3.06 per share, which is much wider than the consensus forecasts of a loss of $1.73.
US Steel (X) said the pandemic led the company to idle a significant amount of its steel making operations.
The company believes Q2 will likely form a trough for the rest of the year. US Steel is down about 8% midway through Wednesday’s session.
Let’s review US Steel’s stock price chart with weekly cycle analysis.
At askSlim we use technical analysis to evaluate price charts of stocks, futures, and ETF’s. We use a combination of cycle, trend and momentum chart studies, on multiple timeframes, to present a “sum of the evidence” directional outlook in time and price.
askSlim Technical Briefing:
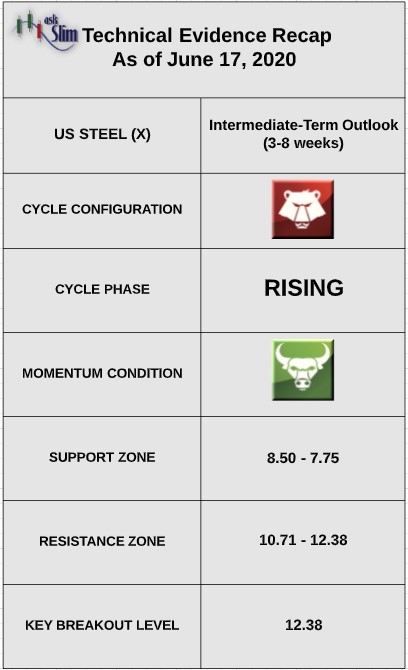
US Steel (X) is in the late stages of a rising phase in a very negative cycle pattern.
We have overlaid the DBB weekly cycle (marked in blue). The DBB is the Invesco DB Base Metals Fund. The fund holds equal weights of Aluminum, Copper and Zinc futures.
We actively track the correlation between the DBB and stocks in the materials sector. The next projected intermediate-term low in US Steel is due in early August. The next projected intermediate-term low in DBB is due in the middle of August.
On the upside, there are intermediate-term resistances in US Steel from 10.71 – 12.38.
On the downside, there are intermediate-term supports from 8.50 – 7.75.
For the bulls to regain control of the intermediate-term, we would likely need to see a weekly close back above 12.38.
askSlim Sum of the Evidence:
X is in the late stages of a rising phase in a very negative overall cycle pattern. Given these conditions, there is a likelihood the stock trades back below 8.50 by August.
Interested in askSlim?
Get professional grade technical analysis, trader education and trade planning tools at askSlim.com. Write to matt@askslim.com and mention See It Market in your email for special askSlim membership trial offers!
Twitter: @askslim
Any opinions expressed herein are solely those of the author, and do not in any way represent the views or opinions of any other person or entity.


