Important short-term flashpoints are converging as US Equity Markets head into the final stretch of 2013. I believe these emerging flashpoints are worth considering in your short-term working thesis for stocks.
Here is my list of flashpoints for the US Equity Markets, along with accompanying analysis.
Flashpoint #1: S&P 500 Momentum & Extreme Mean Deviation
The S&P 500 (SPX) daily chart continues to show a Negative Momentum Divergence. It indicates that recent new bull market highs have been supported by residual buying pressure left over from the impulsive thrust off the October lows.
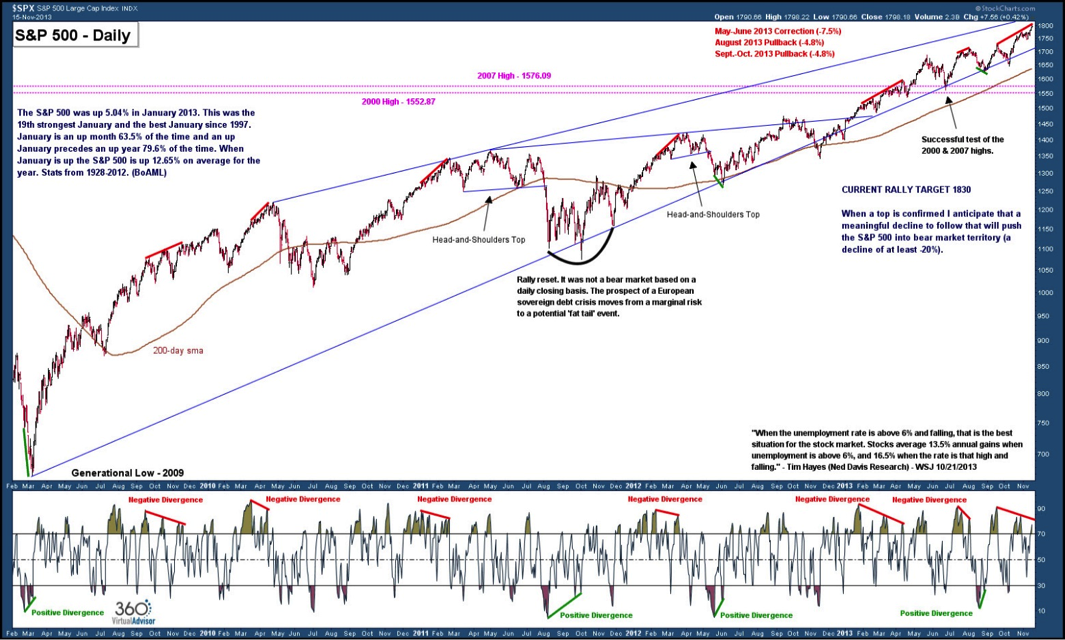
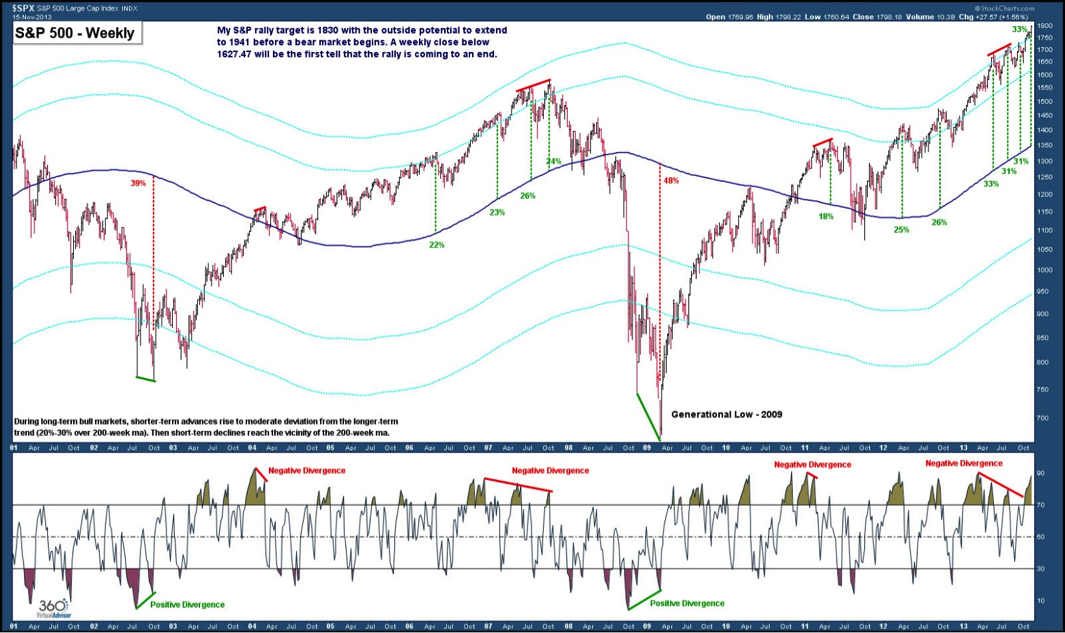
Last week’s breakout into new bull market highs removed the Negative Momentum Divergence on the weekly chart of the S&P 500. The index is now showing an extreme deviation from the mean (200-week sma) and is overbought. The current deviation is similar to the readings that preceded or coincided with the May – June correction (-7.5%), the August pullback (-4.8%) and September – October pullback (-4.8%).
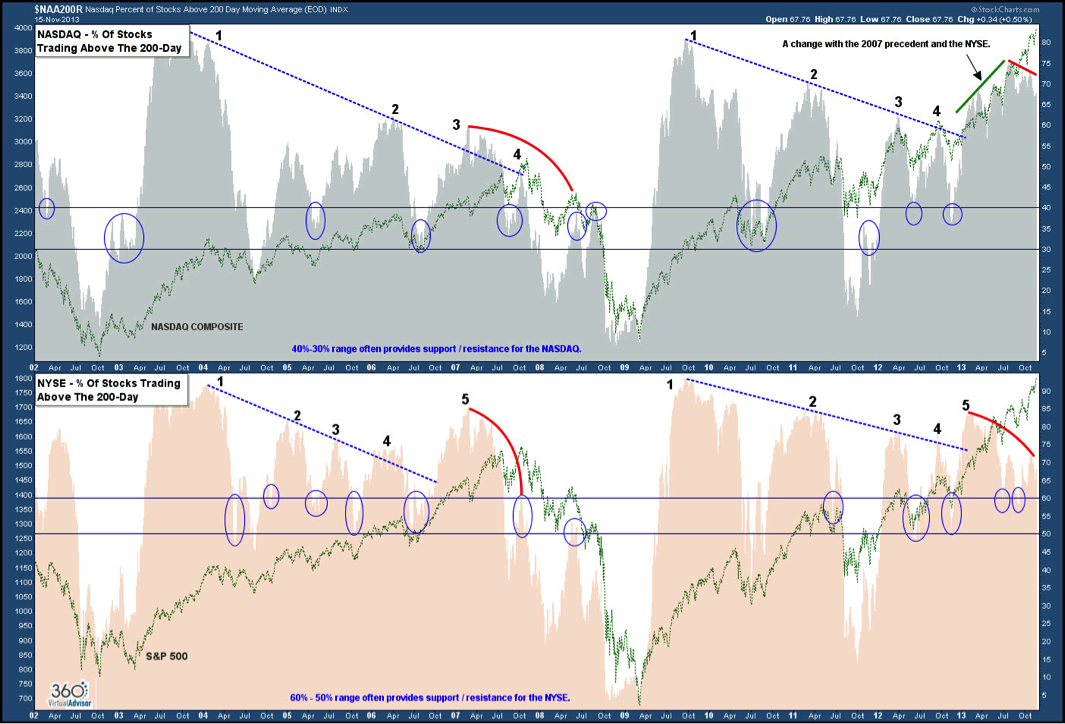
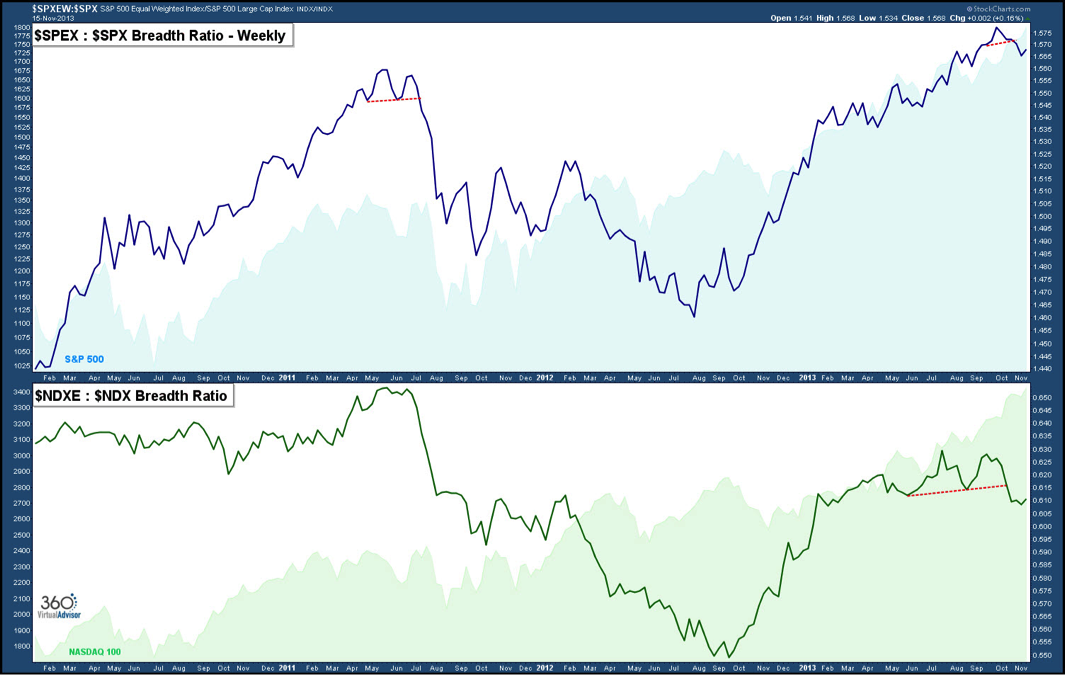
Flashpoint #2: General Market Breadth
The early 2013 breakout for the percentage of NASDAQ (COMPQ) stocks trading above the 200-day sma was a bullish development and a distinct break with the 2007 analog. Since mid-September new NASDAQ bull market highs have been printed while the percentage has been declining. NASDAQ breadth has fallen in line with the bearish NYSE breadth.
If the NYSE percentage falls below 50% it will confirm an important equity market high is in place. The 30% level is key for the NASDAQ.
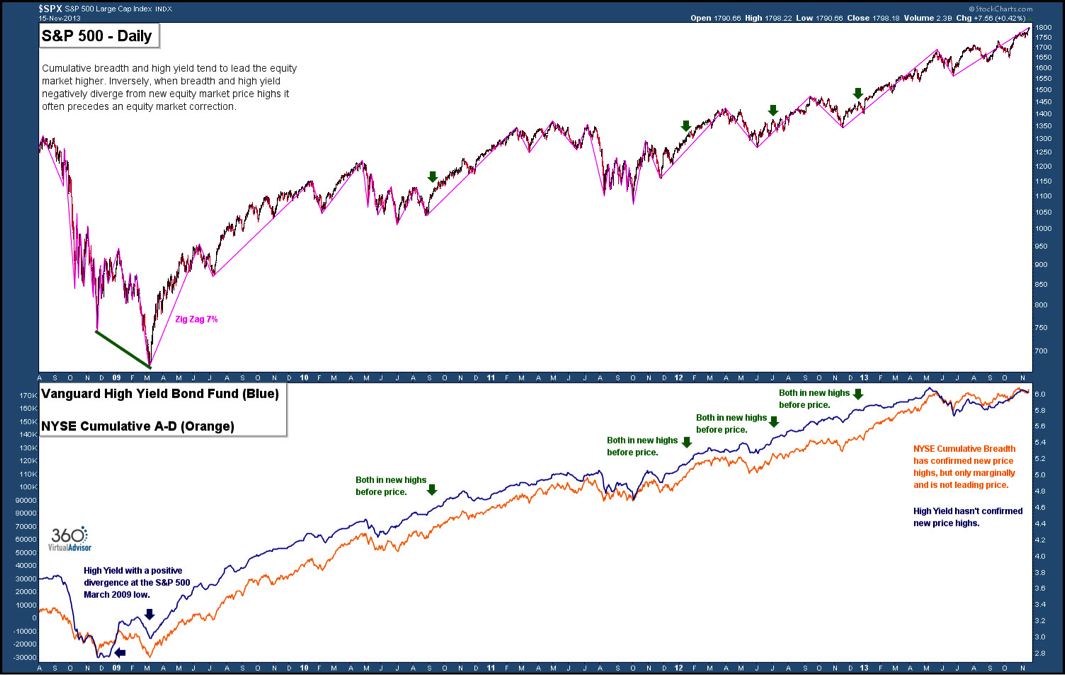
Since May NYSE Cumulative Breadth has struggled to confirm new equity market highs and as of Friday’s close it is once again lagging price. Adding to the tailwind is the continued negative divergence of high yield. Since the 2009 both have lead the equity market into new highs, not lagged.
The breadth deterioration is manifested in the relative underperformance of the S&P 500 and NASDAQ 100 (NDX) equal weighted indexes. A narrower group of stocks are attracting the buying attention.
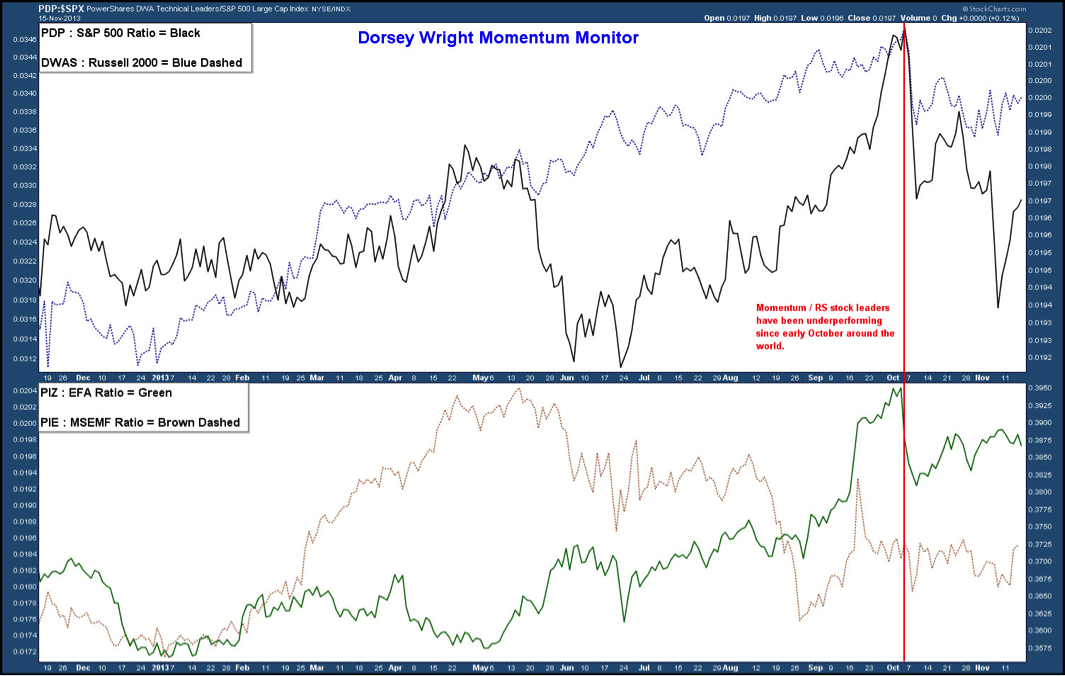
Flashpoint #3: RS / Momentum Stock Leadership
High RS / momentum equities tend to outperform in risk-on environments. The underperformance of the technical leaders around the world since early October indicates that market participants are leaning towards lower beta equities.
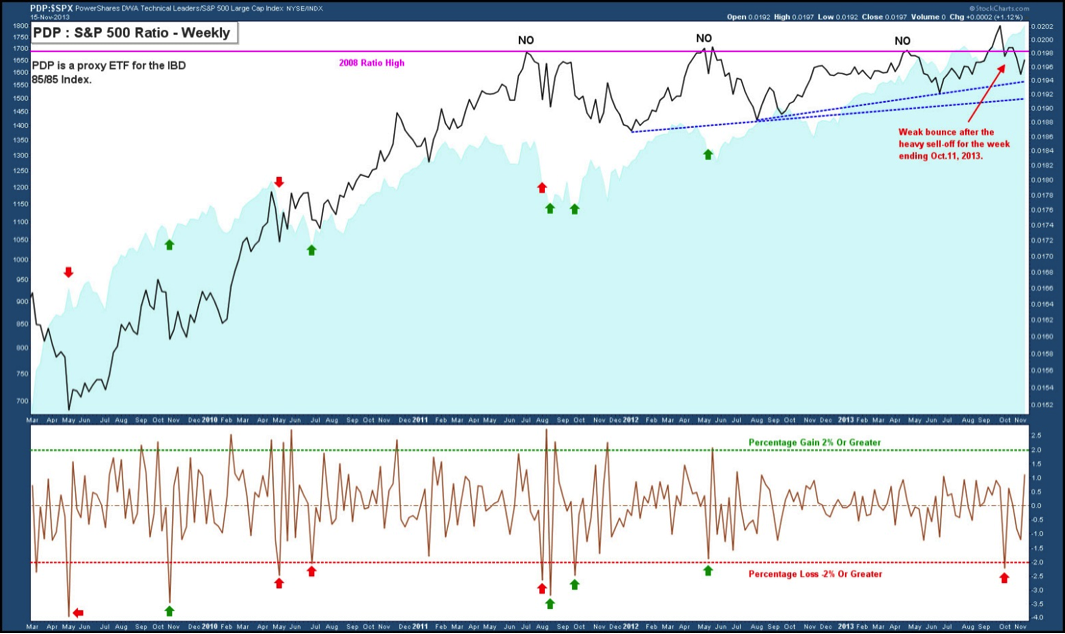
The fourth failed breakout attempt above the 2008 high for the large-cap momentum leadership is at least a short-term bearish development.
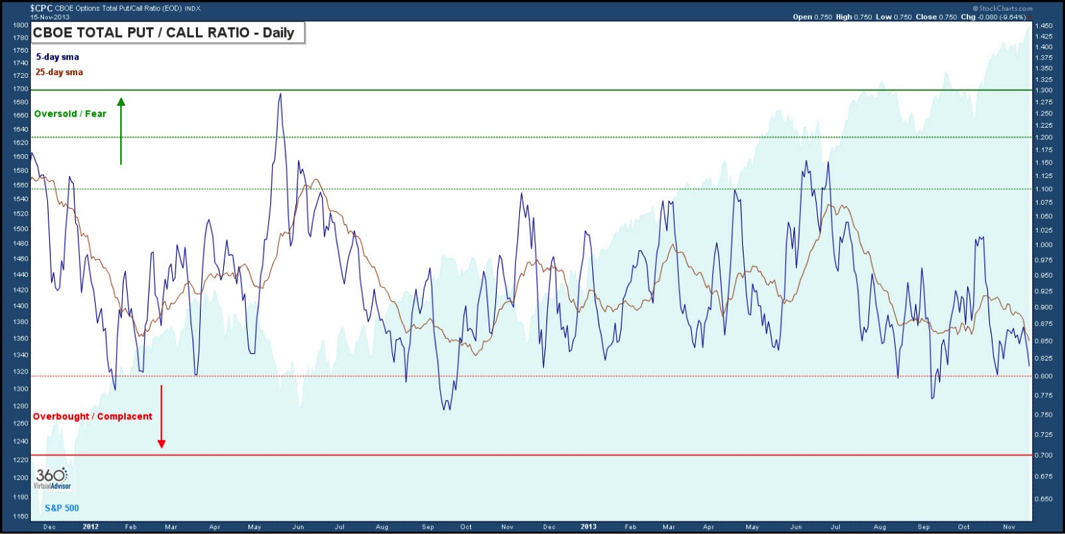
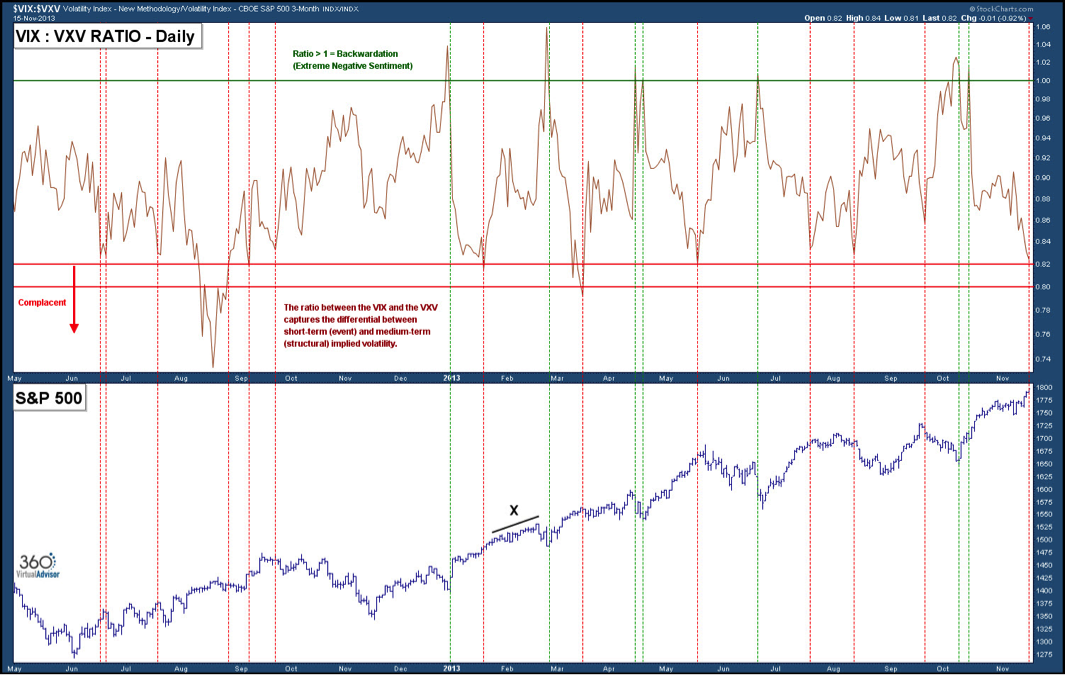
Flashpoint #4: Complacency
The CBOE Put/Call Ratio is flashing complacency, particularly the 25-day sma. It has fallen down to the September 2012 level.
Event / structural volatility indicator is confirming a heightened level of complacency in the US Equity Markets.
Conclusion
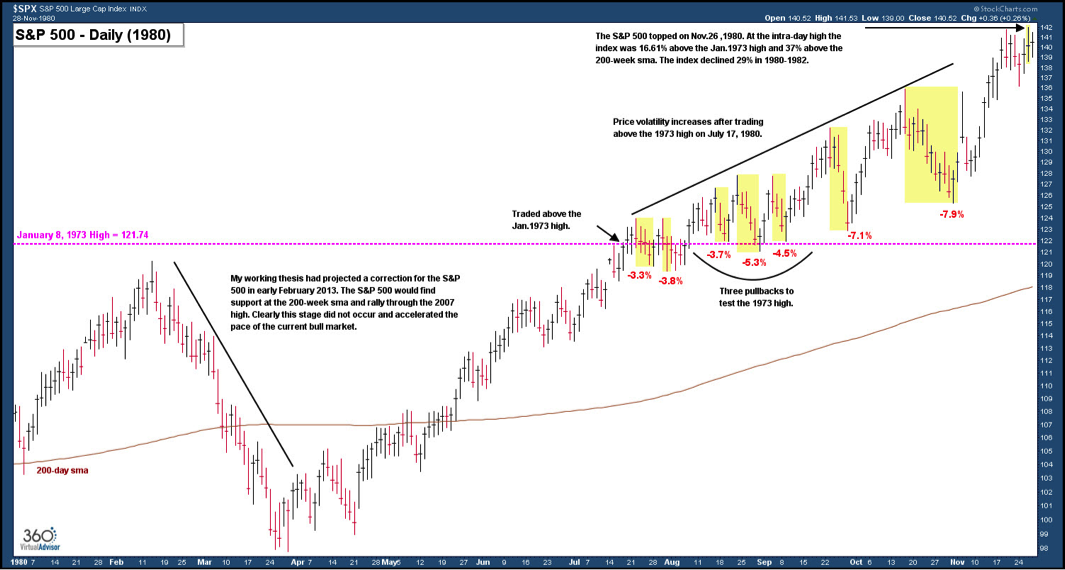
There are building obstacles for the equity market that could trigger at least a pullback. A pullback or mild correction would fit well with the 1980 analog.
Price volatility has increased since the secular breakout above the 2000 and 2007 highs in April. The correction and two pullbacks are consistent with the last breakout from a secular bear market. In 1980 the S&P 500 registered three pullbacks (-3.7% | -5.3% | -4.5%) and two corrections (-7.1% | -7.9%) following the breakout above the 1973 high. Don’t be surprised to see the market continue to see pullbacks followed by new marginal bull market highs before a notable correction (-20% or more) emerges.
In closing, it is important to emphasize that my longer term outlook for US Equity Markets is positive. This is not a bubble environment, but the beginnings of a secular bull market breakout. My price target for the S&P 500 remains 1830. The probability of at least a short-term pullback is high. A decline below 1627 would be the first tell that the S&P 500 has made an important intermediate high. And any correction beyond that level could carry the S&P 500 to the vicinity of the 200-week sma which is currently at 1350. Thanks for reading.
Twitter: @hertcapital
The author is currently net long with positions in SPR, URI, SIVB, SCHW and short exposure in select emerging market ADRs and ETFs.
All charts used are sourced from StockCharts.com. Any opinions expressed herein are solely those of the author, and do not in any way represent the views or opinions of any other person or entity.

: Showing Some Signs of Emerging Strength")
