Key Stock Market Takeaways:
Price rally running into resistance with price and momentum trends still lower. Breadth thrusts have not been confirmed by meaningful improvement in industry group trends. Pessimism is fading as stocks have moved away from December’s panic-induced selling.
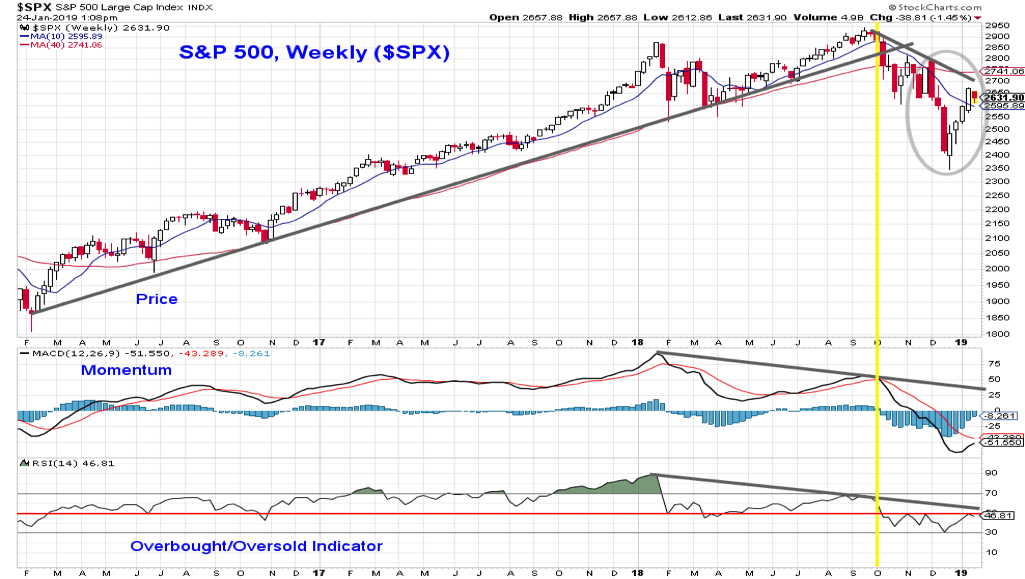
The initial rally off of the late-December lows has stalled as the popular averages have moved into areas of resistance. Stepping back, the four-week-long rally on the S&P 500 (which produced a 13% gain) has done little to change the longer-term trend.
In fact, as seemingly impressive as the move off of the Christmas Eve lows has been, it has not undone the price weakness that emerged over the preceding three weeks. The deterioration in the price trend since early October has been accompanied by further weakening in momentum and a decisive move by overbought/oversold indicators into the bottom half of their range (which is historically consistent with downtrend in price).
During sustained up-trends, these indicators tend to remain in the top half of their range. From here, the path forward could become more challenging. While breadth thrusts have emerged, longer-term breadth trends have not taken a leadership position. The rally that emerged in the wake of panic-induced selling now has to contend with a sentiment backdrop that is decidedly less pessimistic.
While a meaningful re-test of the December lows may be the most likely path forward, we will be watching the breadth and sentiment data closely to confirm or refute this expectation.
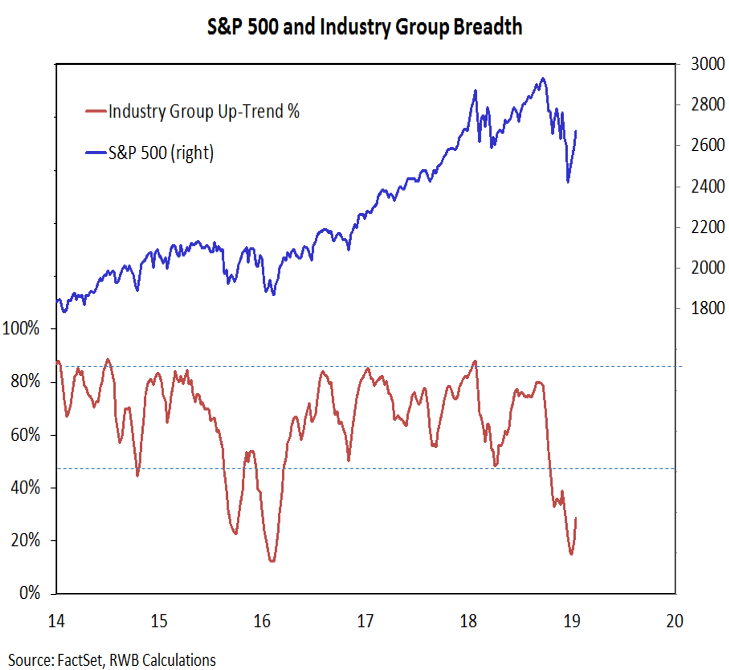
We have recently discussed both the message from early year breadth thrusts (After Evidence of Panic, Breadth Thrusts Could Buoy Market) and emerging rally leadership (Watch Rally Leadership for Evidence of Persistent Strength). While the tone in some of the breadth data has improved, longer-term breadth trends remain challenging. Specifically, the percentage of industry groups in uptrends has risen from its early –year low of 15%, it remains historically subdued at under 30%. A reading above 50% would suggest that a broadly-supported up-trend has emerged.
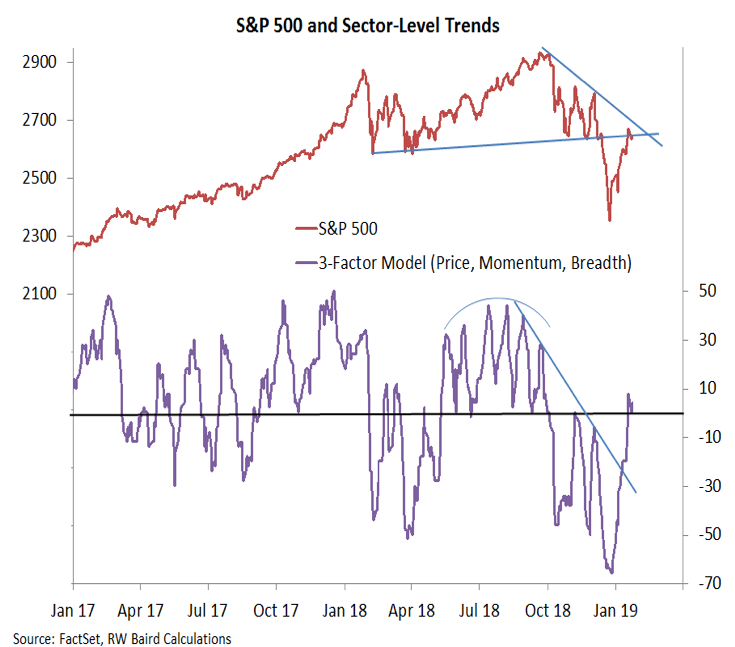
We have seen more substantial improvement in broad-markets when looking at an aggregation of sector-level price, momentum and breadth trends. After bottoming at the bottom of its range in late December (meaning that short-term price, momentum and breadth trends for all eleven S&P sectors were moving lower), this indicator has bounced back to a more neutral reading. Renewed deterioration in sector-level trends would suggest a meaningful re-test on the S&P 500 may be emerging. Steady or improving trends at the sector-level would suggest that the index may have more room to run on the upside.
The late-2018 stock market weakness was accompanied by widespread investor pessimism. This has since reversed. The latest data from Investors Intelligence shows twice as many bulls as bears after briefly seeing more bears than bulls in the first week of January.
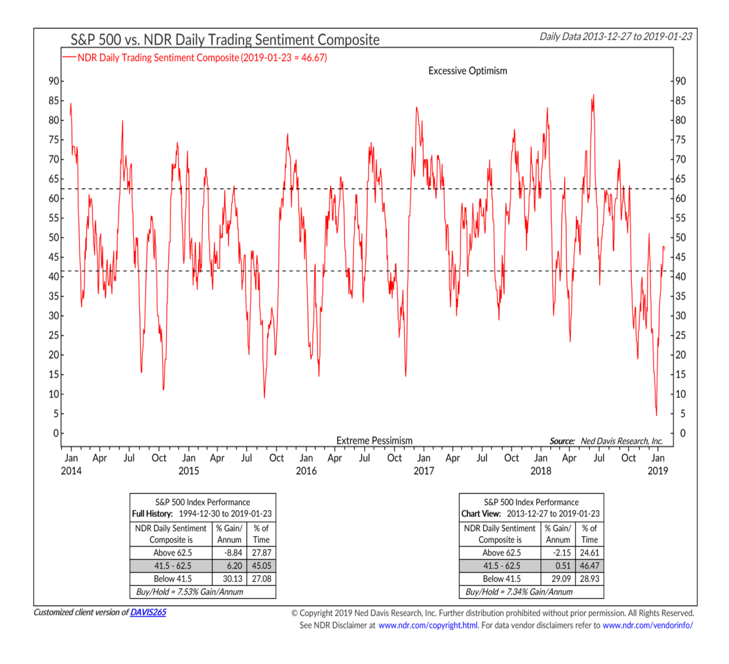
Similarly, the NAAIM exposure index has moved from a mid-December low in the 30’s to readings in the 70’s the past two weeks. Optimism has been slower to return in the AAII survey, but the drop in pessimism has been notable there as well. The Ned Davis Research (NDR) Trading Sentiment Composite aggregates this data (as well as some options-related indicators) into an overall measure of sentiment – see chart below. The pessimism that was evident in late-2018 has faded. A quick return to optimism could be a headwind for stocks.
We can also see evidence of investor attitude in the fund flow data. The nearly $100 billion in equity fund outflows in the four weeks that ended 2018 suggest some degree of panic emerged in the December sell-off. That likely helped pave the way for the January bounce that has been seen in stocks. The latest weekly data, however, shows that equity funds are again seeing inflows, and the four-week total has moved from $95 billion in outflows to $9 billion in outflows over the course of two weeks.
If this continues, the four-week total could soon shift from outflows to inflows (which have not been seen since very early last year). Some sustained skepticism would be a healthier environment for stocks.
Twitter: @WillieDelwiche
Any opinions expressed herein are solely those of the author, and do not in any way represent the views or opinions of any other person or entity.

 Rolling Over At Key Fibonacci Level?")


 Rolling Over At Key Fibonacci Level?")