Stocks are trading largely mixed, with the S&P 500 (NYSEARCA:SPY) fractionally higher while the NASDAQ 100 (NASDAQ:QQQ) is lower as Technology continues to underperform.
The S&P 500 has stalled near former highs, but it’s tough to call this pattern bearish.
2920 to 2925 remains a key area of upside price resistance. Only a breach of 2883 would be problematic.
Note that both the S&P 500 and Dow Jones Industrials are in better shape than the Nasdaq near-term.
As well, treasury yields continue to press higher, the the 10 Year Treasury Yield (INDEXCBOE:TNX) now up to 3.08 and 2/10 curve up to 27 bps while the Dollar shows evidence of stalling out.
All this makes for a tricky market to navigate.
Here are five key themes I’m watching this week:
- ENERGY: Crude Oil is on the verge of breaking out. Energy looks strong and E&Ps are seeing more signs of Oil Services joining.
- METALS stocks: GDX making decent continuation move. While this has been trending down for some time, the gradual rolling over in the Dollar is bullish for this group
- China starting to re-awaken: Chinese Tech stocks making minor breakout. As per CQQQ while SHCOMP and FXI confirmed Demark buys the other day. Good to start favoring a rally here
- Yields pressing higher: This should favor Financials, which look to have finally come alive today. Most interest sensitive names have been losing ground as expected.
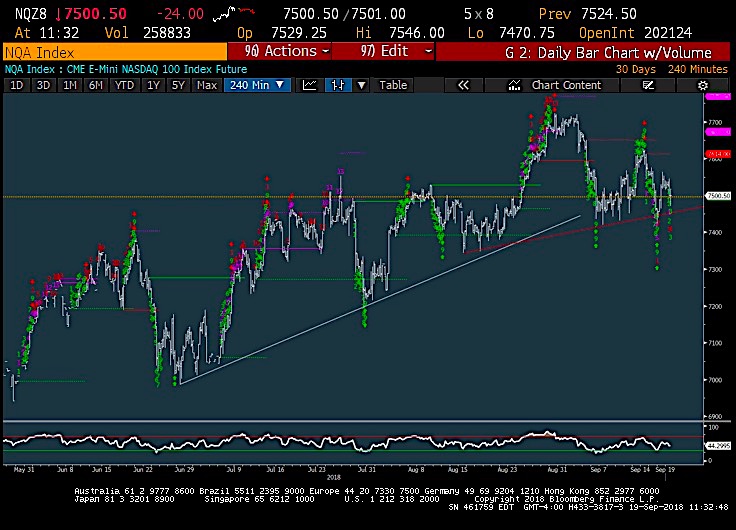
- Technology underperformance. See comments above.
Nasdaq Trading Chart
Twitter: @MarkNewtonCMT
Author has positions in mentioned securities at the time of publication. Any opinions expressed herein are solely those of the author, and do not in any way represent the views or opinions of any other person or entity.
Editor’s Correction: The chart above was originally labeled S&P 500 Trading Chart; it has been changed to Nasdaq Trading Chart.

 Rolling Over At Key Fibonacci Level?")


 Rolling Over At Key Fibonacci Level?")

