I have reviewed all of the U.S. stock market indices and many are at, or very close to, price areas where we would expect some near-term weakness.
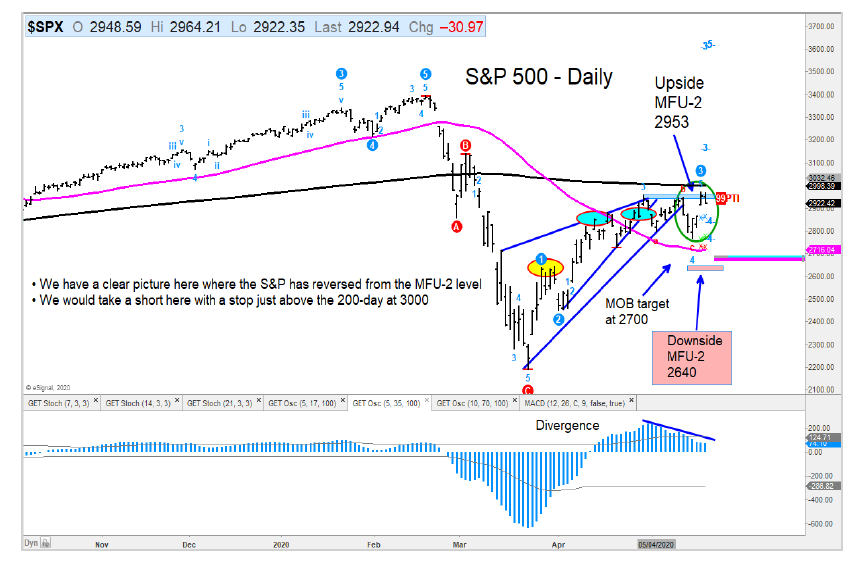
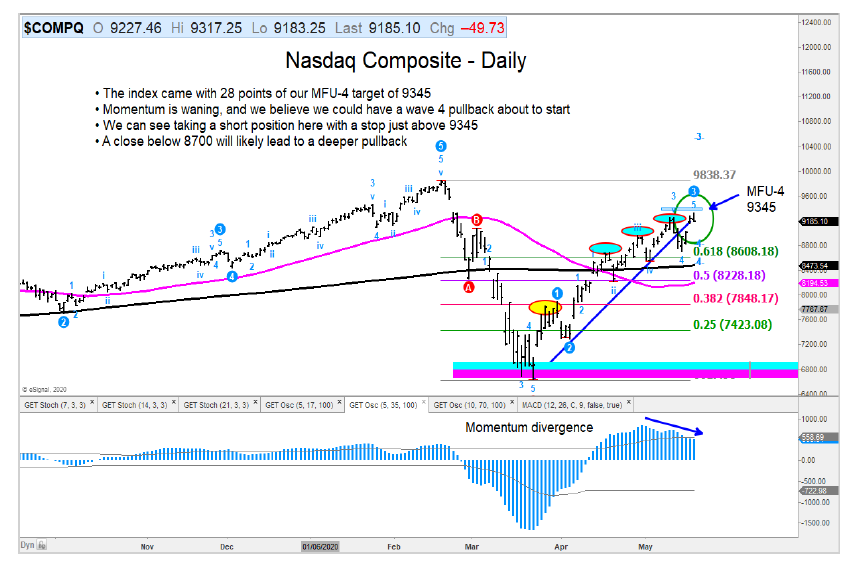
The S&P 500 Index INDEXSP: .INX is near a Money Flow Unit (MFU) price target and just below its 200 day moving average. The Nasdaq Composite INDEXNASDAQ: .IXIC is also close to a key MFU target.
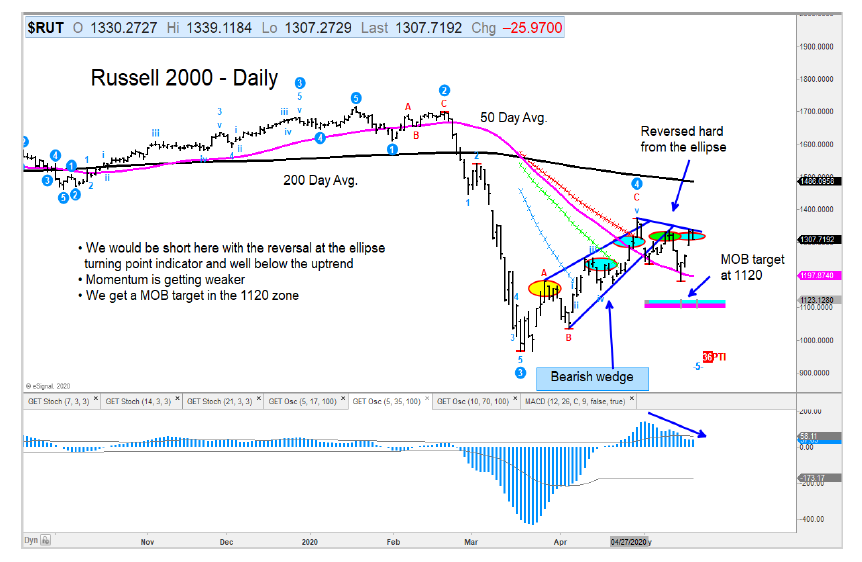
The Russell 2000 Index INDEXRUSSELL: RUT and the Mid-Caps NYSEARCA: MDY are in rough shape and are among my favorite short ideas.
U.S. Equity Market Technical Notes:
– After last week’s pullback and then sharp rally, we have a number of indices back up to those prior highs or lower with many generating ellipse sell signals.
– The S&P 500 Index rallied right back into its MFU-2 target area of 2953, and I would be short.
– My favored index Nasdaq Composite was shy of hitting its MFU-4 target of 9345 with today’s high. What now bothers us is the loss of upside momentum and how close it is to that target zone. We are expecting short-term weakness from here.
– The Russell 2000 and Mid-Cap (MDY) look like a disaster ready to happen. Please note the recent lower highs made on the daily charts. The bearish wedge patterns we pointed out in past reports are still in play.
– Unfortunately, the Dow Transports and Utilities are also in a very weak position, and I expect them to go lower.
The author may have position in mentioned securities at the time of publication. Any opinions expressed herein are solely those of the author, and do not in any way represent the views or opinions of any other person or entity.


