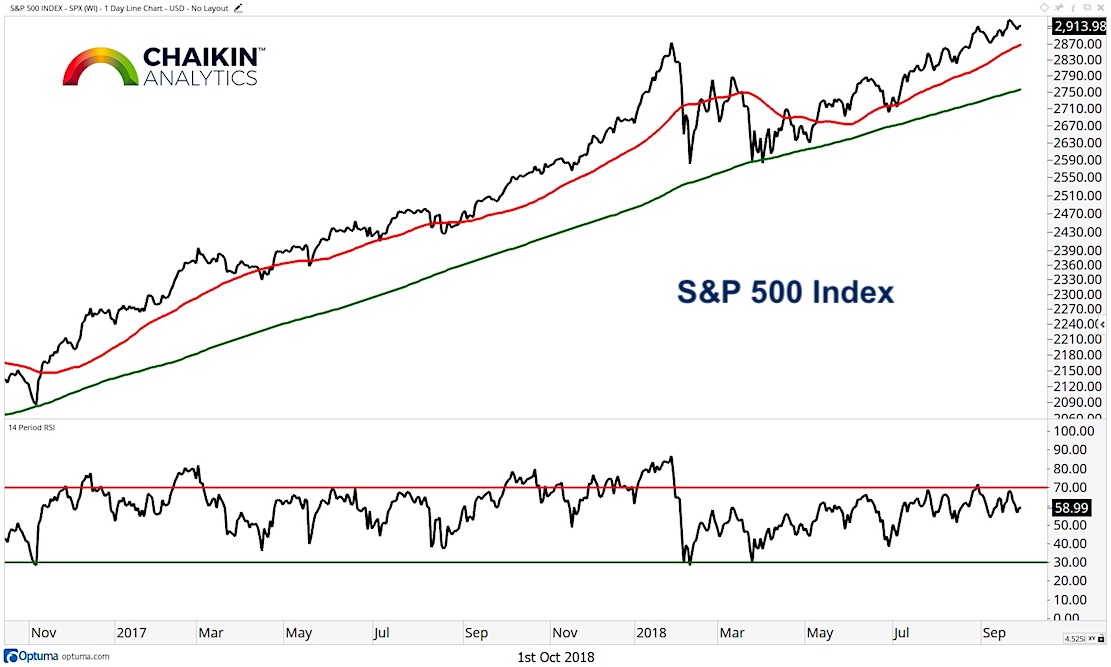
Stocks look set to rally today, but on a “closing” basis, the S&P 500 has pulled back from the all-times highs set two weeks ago but has held near-term support in the 2,910 – 2,915 zone.
The index is above the rising 50 and 200-day moving averages and the RSI is in bullish ranges.
The index has held up very well during the seasonally weak month of September and turned in its best quarterly performance since 2013 in the 3Q.
But there are many stories beneath the surface and across the assets and sectors.
Let’s drill down and see what’s working and where other assets and sectors are headed.
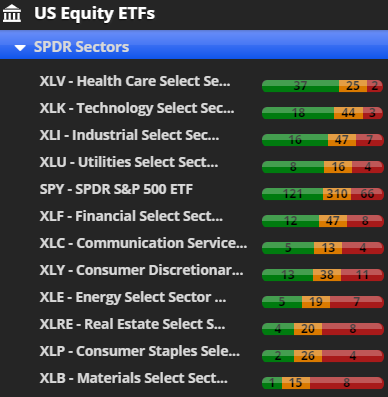
S&P 500 & Sector Power Bars
The Power Bar for the S&P 500 ETF (NYSEARCA: SPY) remains skewed in favor of the bulls but saw a deterioration last week as the market pulled back from all-time highs.

Utilities (NYSEARCA: XLU) fell from the top of the list but remain bullish and ahead of the SPY. The Industrials (NYSEARCA: XLI) have been climbing the leaderboard and remain in the top three sectors. Healthcare (NYSEARCA: XLV) and Technology (NYSEARCA: XLK) have consistently been in the top four and should be used to generate long ideas when strong names become oversold. Materials (NYSEARCA: XLB) Consumer Staples (NYSEARCA: XLP) and Real Estate (XLRE) are the bottom three sectors from a Power Bar Perspective.
Given our view that the market will exhibit a more normal level of volatility than we saw in 2017, it should provide many opportunities for process-driven investors to use periods of weakness to open long positions in strong stocks in leading sectors and industries.
You can gain more insights into our methodology and stock picking over at Chaikin Analytics.
Small Caps Continue to Lag
The iShares Russell 2000 ETF (IWM) continues to test and hold (thus far) support at the prior breakout level. Chaikin Money Flow has turned bearish and the fund is below the rising long-term trend line. Small Cap’s relative strength has diminished over the past few weeks, as large cap stocks have joined the advance, and they are now underperformers. The IWM is closer to oversold based on our Overbought / Oversold Indicator. The Power Bar Ratio for the IWM has seen a deterioration over the past week and is now skewed in favor of the bears.

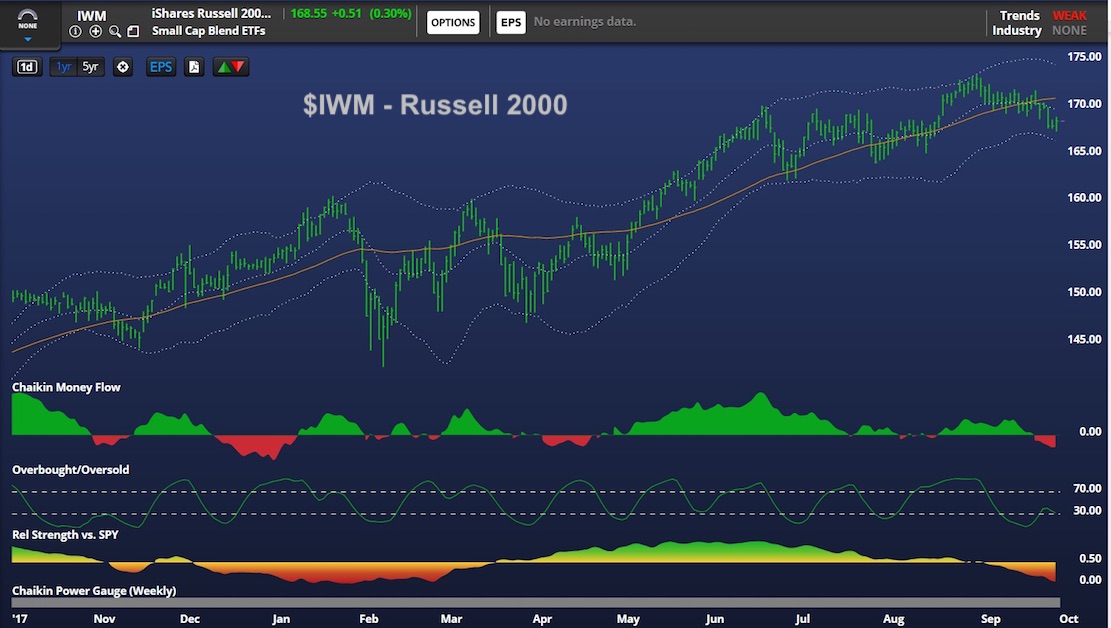
***The Power Bar Ratio tells us how many stocks in each ETF are rated Very Bullish/Bullish, Neutral and Very Bearish/Bearish***
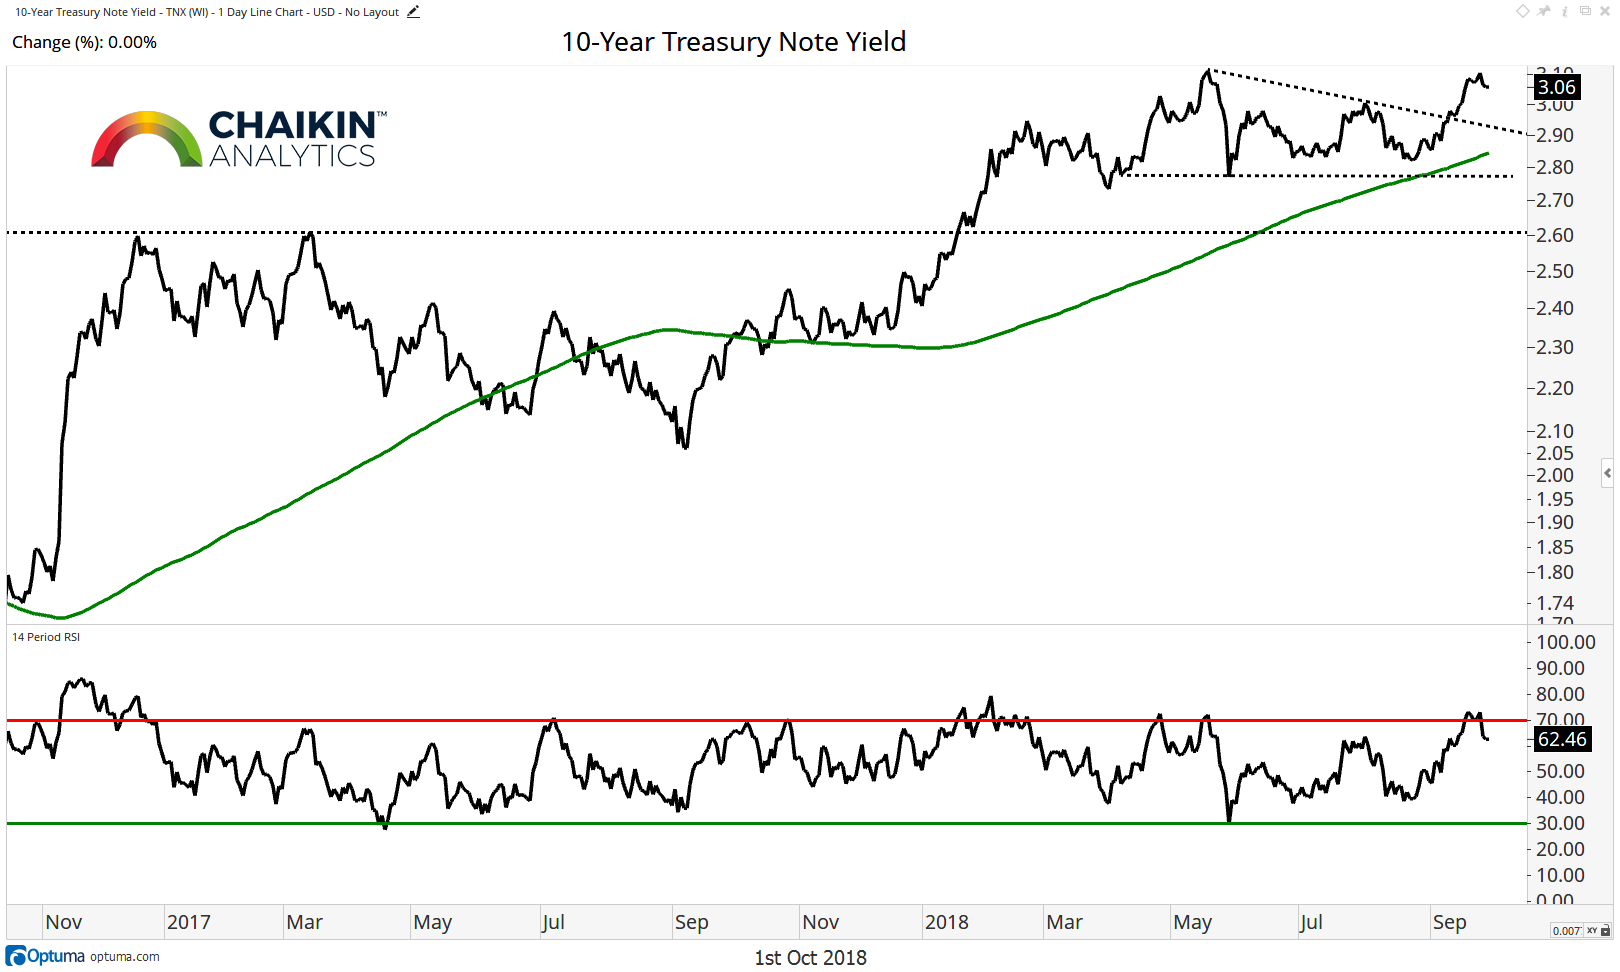
Credit
The 10-year yield fell to 3.06% this week after pulling back from the May highs near 3.1%. Support comes into play in the 2.77% – 2.85% zone (which includes the rising 200-day moving average) then at the key breakout level of 2.60%. As long as yields are above these levels, we expect them to continue to move higher over the intermediate term while remaining open to a consolidation just under the May highs at 3.1% in the near-term.
Credit Spreads Tighten Slightly on the Week
Many investors are focused on the yield curve and the potential inversion of the 2-10 spread which may portend a recession but a metric which is not receiving much attention is credit spreads.
read more on the next page…


