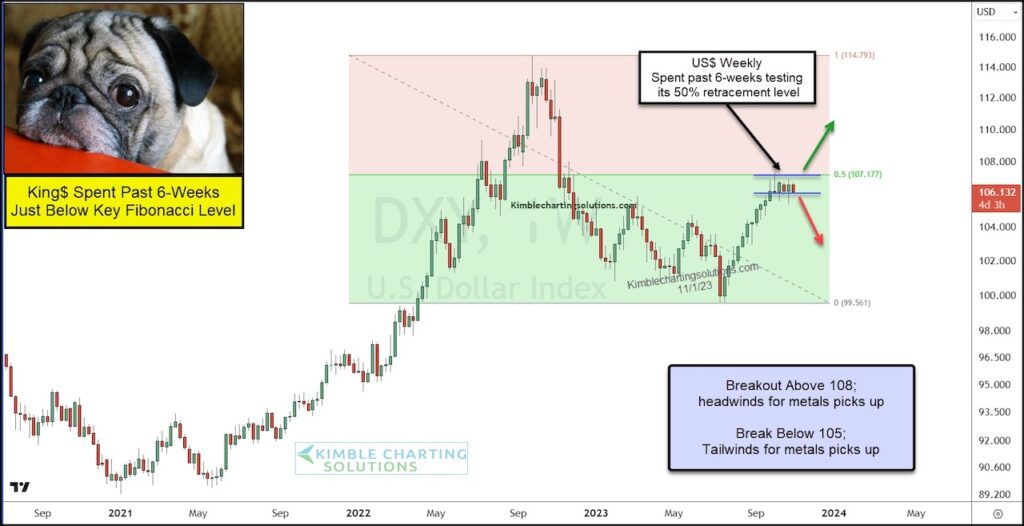
The U.S. Dollar rally has taken a breather, with the King of the currency world trading sideways for the past several weeks.
But there is a reason for this pause, as you can see in today’s “weekly” chart of the U.S. Dollar Index.
King Dollar ran into its 50% Fibonacci retracement level… and stopped on a dime. And the past 6 weeks have been spent trading in a sideways channel.
To Breakout or Breakdown… that is the question.
The resolution of this pattern should send an important signal to numerous asset classes, in regards to its next intermediate move. Commodities and Equities will be watching! Stay tuned!
US Dollar Index “weekly” Chart
Note that KimbleCharting is offering a 2 week Free trial to See It Market readers. Just send me an email to services@kimblechartingsolutions.com for details to get set up.
Twitter: @KimbleCharting
Any opinions expressed herein are solely those of the author, and do not in any way represent the views or opinions of any other person or entity.

 Flirting With Critical Support… Again")


