I’ve put a rudimentary “count” of the US Dollar below because we need to develop a gameplan for the coming Santa Claus rally or Santa Claus puts coal in everyone’s stocking …and, I have NO OVERT OPINION on which direction equities will or won’t go …
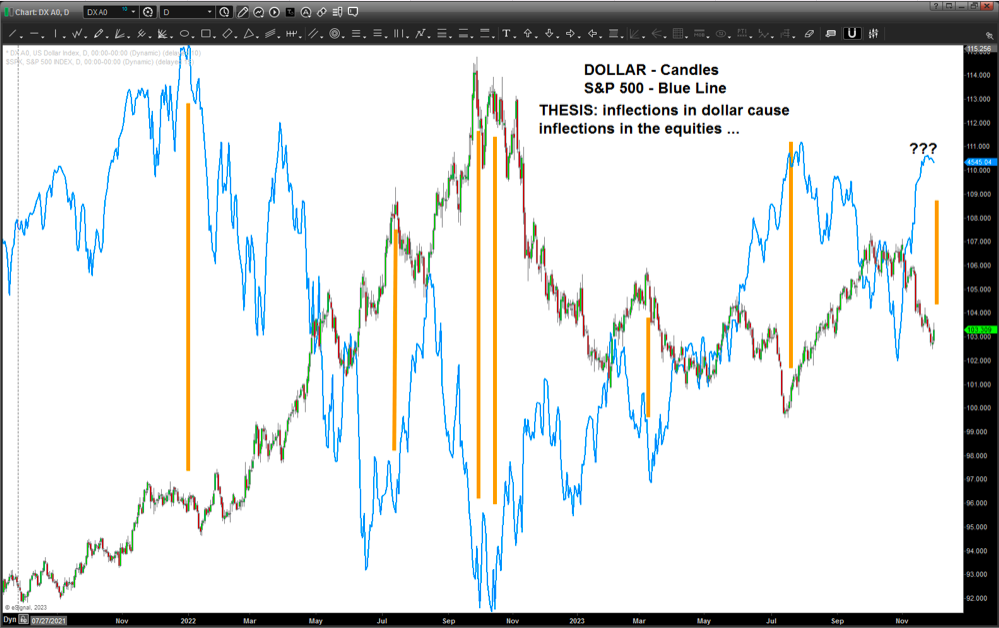
The US Dollar is VERY important for equities .. here’s an overlay of the S&P 500 and the USD … pretty much every inflection in the dollar leads to an inflection in the equities of the US.
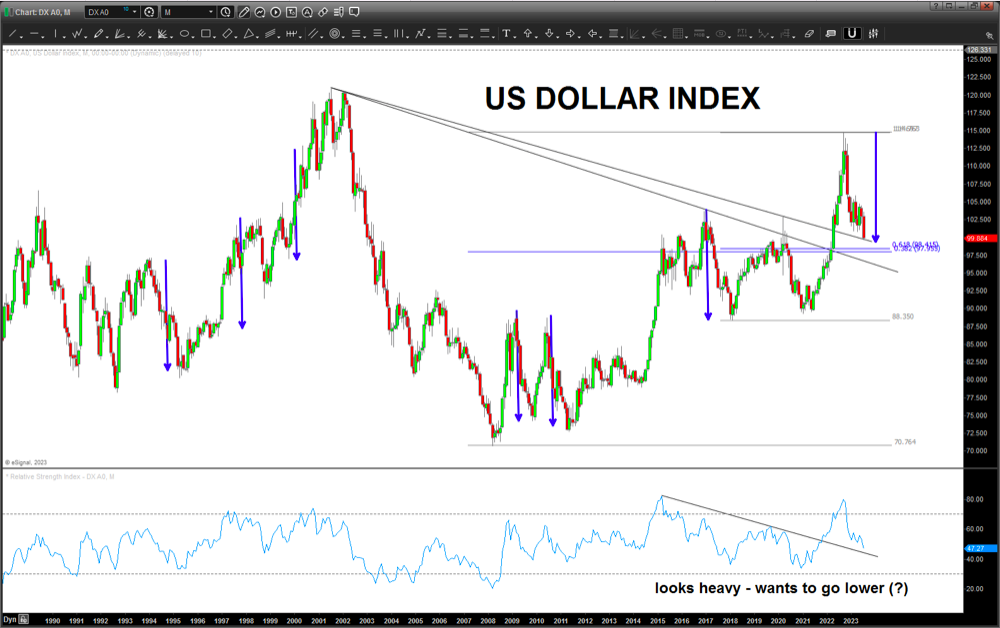
Here is my post on US Dollar: https://bartscharts.com/2023/07/26/us-dollar-index-july-26-2023/
Dollar up – equities down.
Dollar down – equities up.
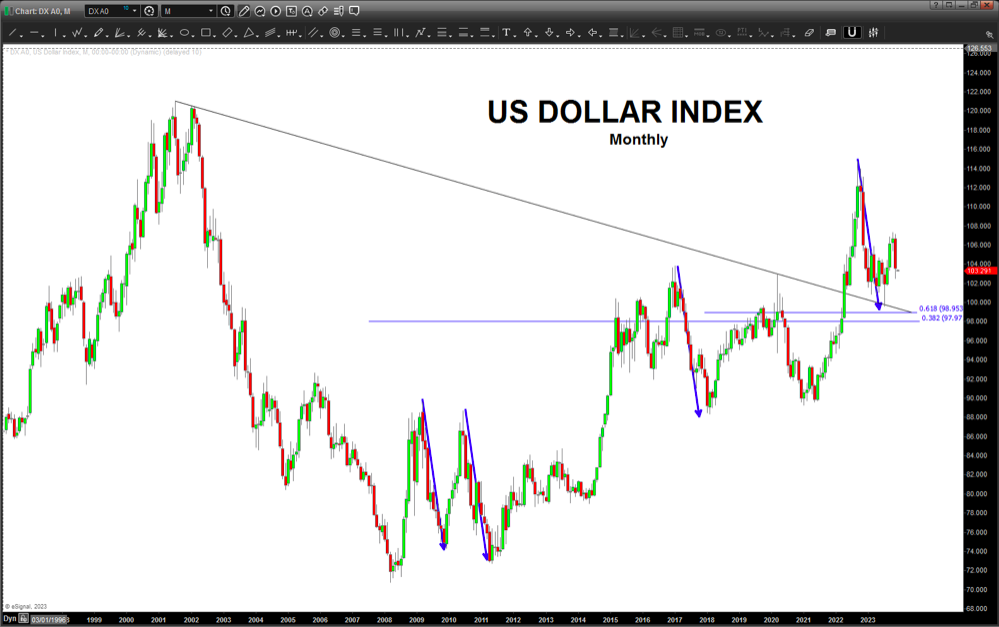
If you have been following this blog for a while, you know I pretty much “live and die” by the measured move and I was watching the dollar corrective measured move like a hawk and it did not disappoint. It hit perfectly … here it is “real – near real time.”
That level hit nicely and the USD has moved nicely higher as shown below:
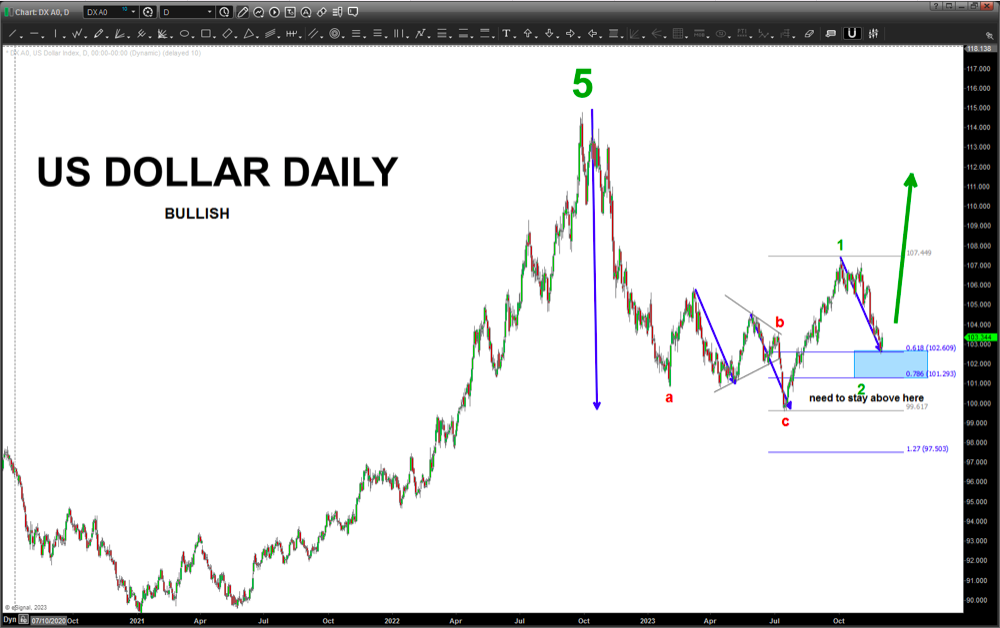
So, where are we ? Yes. LOL.
The count is very interesting and, knowing my golf game and counting strokes on the course I’ll give it my best shot. The bullish scenario came from my friends at Elliott Wave. They see the consolidation as a triangle … I didn’t, but it make sense.
This is a BULLISH DOLLAR and therefore BEARISH EQUITIES:
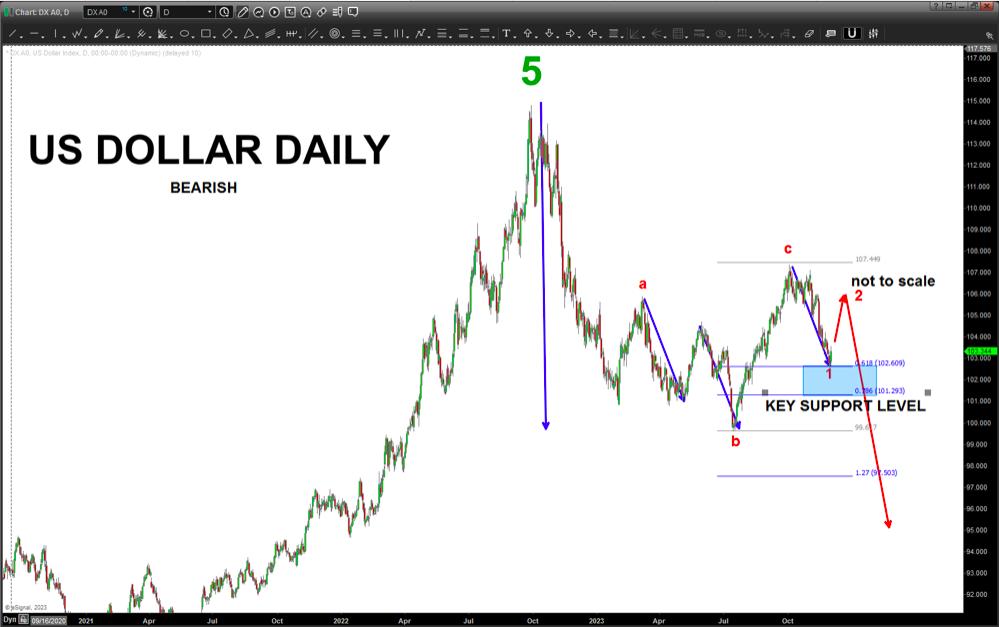
The next one just “looks” better and that’s an expanded flat which, if correct, makes this move down in the dollar probably the 1st of 5 to come in a C wave which will take the dollar substantially lower AND cause equities to find support/continue higher and/or dare I say rocket ship higher?
For now, the bearish dollar count below could rally a few days and then sell off again …
NO MATTER WHAT – FOR ANY OF THE SCENARIOS THE BLUE RECTANGLE ZONE WILL BE THE KEY. PERIOD.
What I’m “concerned” about is the TIME component of the bullish chart above. We are correcting a 5 wave move that was 15 years in the making. On the first wave two correction (a perfect ABDC OBTW) it took “two” of the blue measured moves before it started rocking and rolling again … the wave four correction had one of the blue arrows and the other wave down wasn’t an exact measured move but notice the TIME that it took … so, now, after this 15 year move your going to simply do one “blue measured move” correction down and that’s the a-b-c and off we go higher?
I just don’t think so …
VERY BIG DEAL FOR THE USD HERE AND NOW …
Get after it …
Be sure to check out my unique analysis of stocks, commodities, currencies over at Bart’s Charts. Stay tuned and thanks for reading.
Twitter: @BartsCharts
Author does not have a position in mentioned securities at the time of publication. Any opinions expressed herein are solely those of the author, and do not in any way represent the views or opinions of any other person or entity.


