The US Dollar Index (CURRENCY:USD) and Bullish Dollar ETF (NYSEARCA:UUP) are forming a double bottom price pattern on their respective trading charts.
As well, both patterns are taking shape at yearly pivot (YP) support levels, adding strength to the potential pattern (and support).
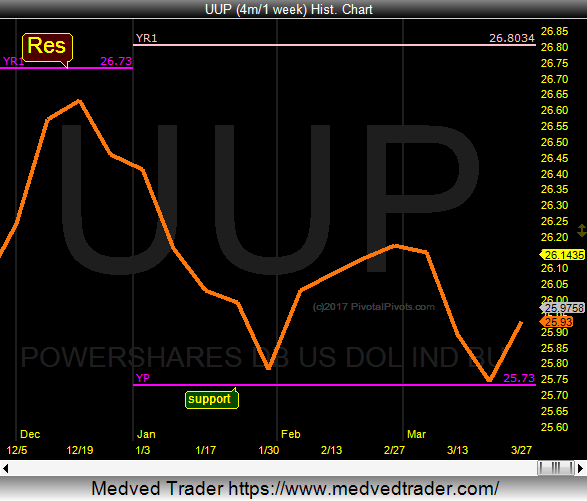
With all the uncertainty going on regarding the euro zone, the Greenback may be set to rally. A move higher could see the Dollar rally up to the Yearly R1 pivot. See chart below.
Bullish US Dollar ETF (UUP) Chart w/ price pivots.
The biggest reversals happen at the Yearly Pivot Points! Check out my last post here on the S&P 500 Yearly Resistance Pivot.
Thanks for reading.
Twitter: @Pivotal_Pivots
The author may have a position in mentioned securities at the time of publication. Any opinions expressed herein are solely those of the author, and do not in any way represent the views or opinions of any other person or entity.


