This past year has seen the US Dollar Index (CURRENCY:USD) slide nearly 10 percent. And this action has brought out the Dollar bears.
But could this all be part of a very bullish chart pattern?
If so, the US Dollar could be headed much higher.
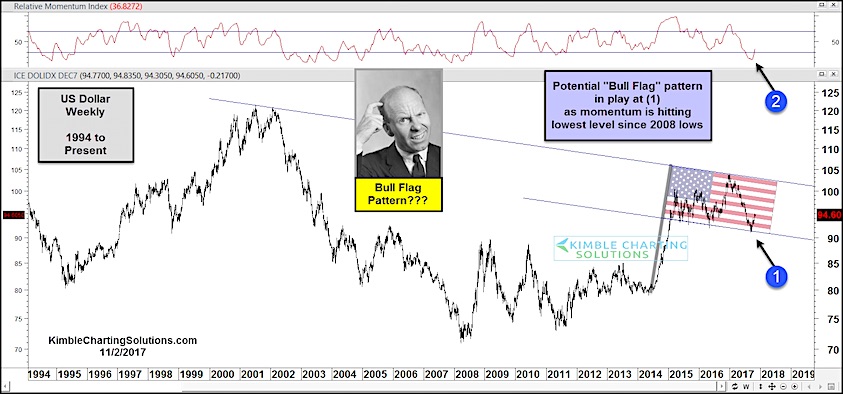
The chart pattern that I am referencing is a “Bull Flag” continuation pattern. As the flag depicts below, this could be very bullish if the US Dollar breaks above the top of the flag. Still a ways to go, but the parameters of the flag are well defined.
Note that the Dollar recently recorded its lowest momentum reading since 2008. At that time, the greenback was closer to 70… now its at 90. This divergence should help to provide a floor of sorts for the Dollar.
Note as well that the Dollar broke out of a long-term rounded bottom (formed between 2004 and 2014), with its rally creating the “flag pole” (gray line).
US Dollar Index 1994-Present – Is That A Bullish Flag Pattern?
This pattern holds bears importance to portfolio managers and traders alike, as a move higher in the dollar would pressure precious metals, commodities, and emerging markets. So stay tuned!
Twitter: @KimbleCharting
Any opinions expressed herein are solely those of the author, and do not in any way represent the views or opinions of any other person or entity.


 Ready To Break Out?")

")
 Ready To Break Out?")
