Just two weeks ago, I identified a key price support level for the US Dollar Index (and the currency markets) to start 2018.
That level has failed to hold… and this opens up a very important test of the 88 to 89 chart support level for the greenback.
Major US Dollar Chart Support
As noted in the last post, this is a ‘key’ moment where the US Dollar will either find support and begin another huge leg up OR confirm that a C wave is complete and new lows on the dollar are on the way in the coming months/years (this with regard to the low that was carved out back at 70 in March of 2008).
This basically comes down to Elliott wave theory and principles. Go back and read my last post as to why Dollar bulls need this level to hold…
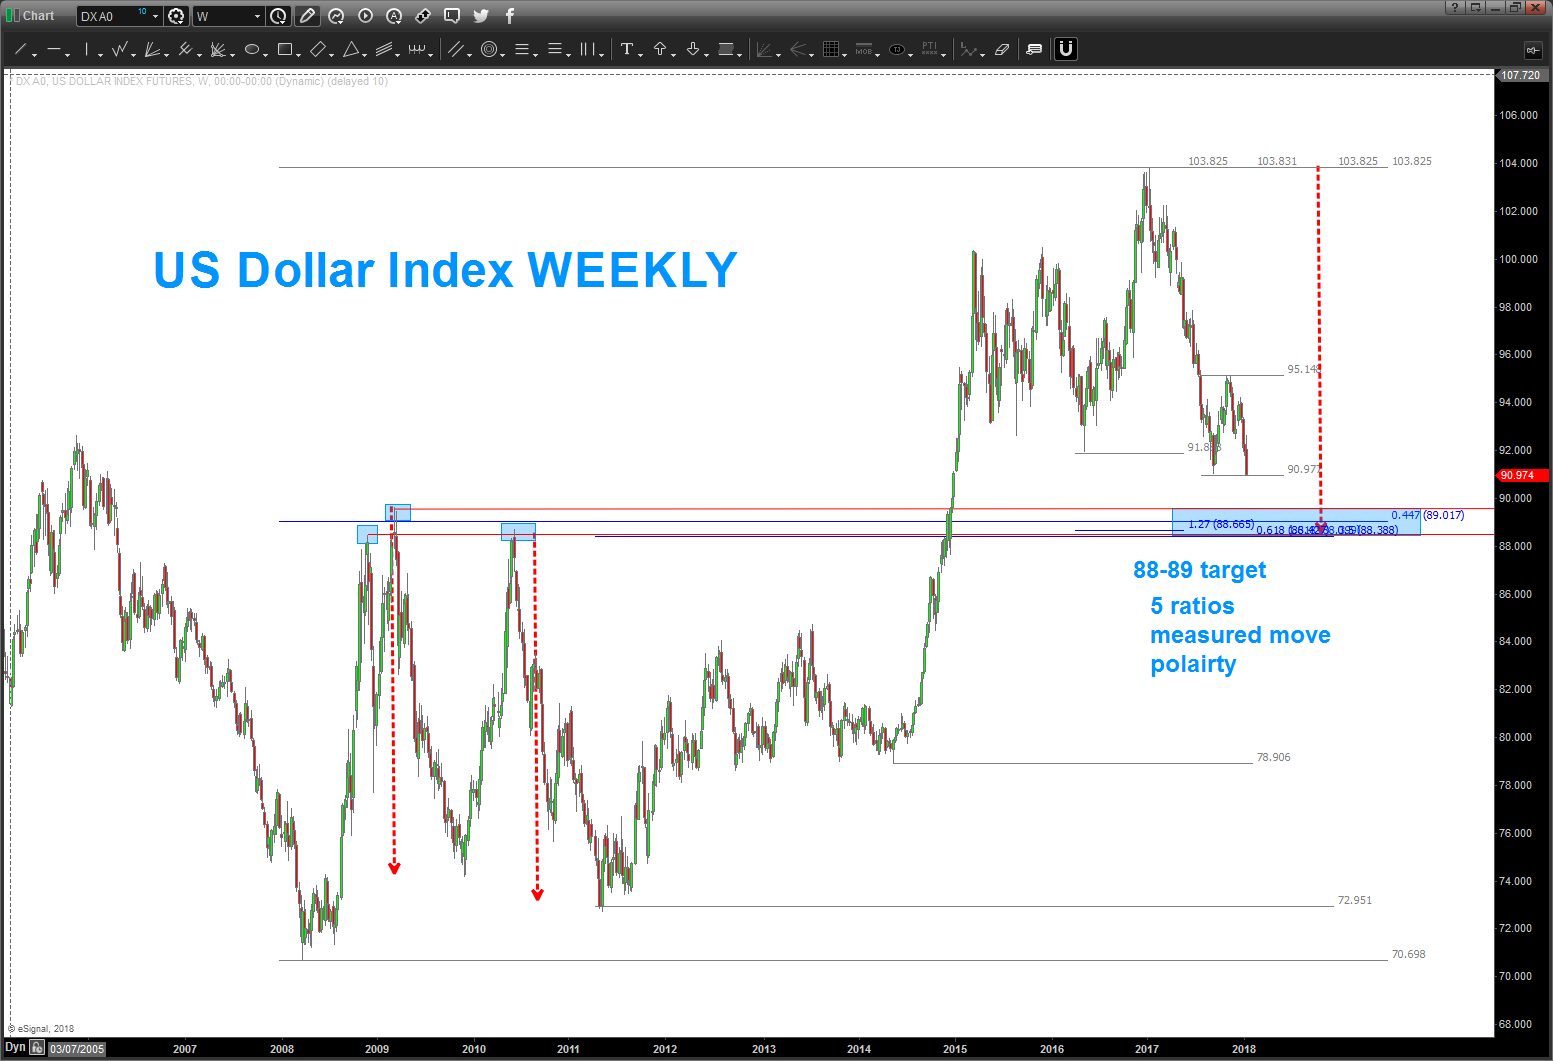
In addition to wave principles, we have 5 ratios coming together, a measured move and polarity. Needless to say, it’s going to be a very important battle for that level in the coming days and weeks ahead.
U.S. Dollar Index Chart
Twitter: @BartsCharts
Author does not have a position in mentioned securities at the time of publication. Any opinions expressed herein are solely those of the author, and do not in any way represent the views or opinions of any other person or entity.


