 I’m an avid watcher of the US Dollar. One of the reasons I like to monitor the US Dollar is because it can provide insights as to where other asset classes may be heading. In particular, commodities like Gold, Silver, and Crude Oil often take cues from the Dollar. Typically, a lower US Dollar means higher commodity and precious metal prices. Below are a few charts that I found interesting as I was analyzing the US Dollar. By all accounts, the Dollar may be gearing up for a big move.
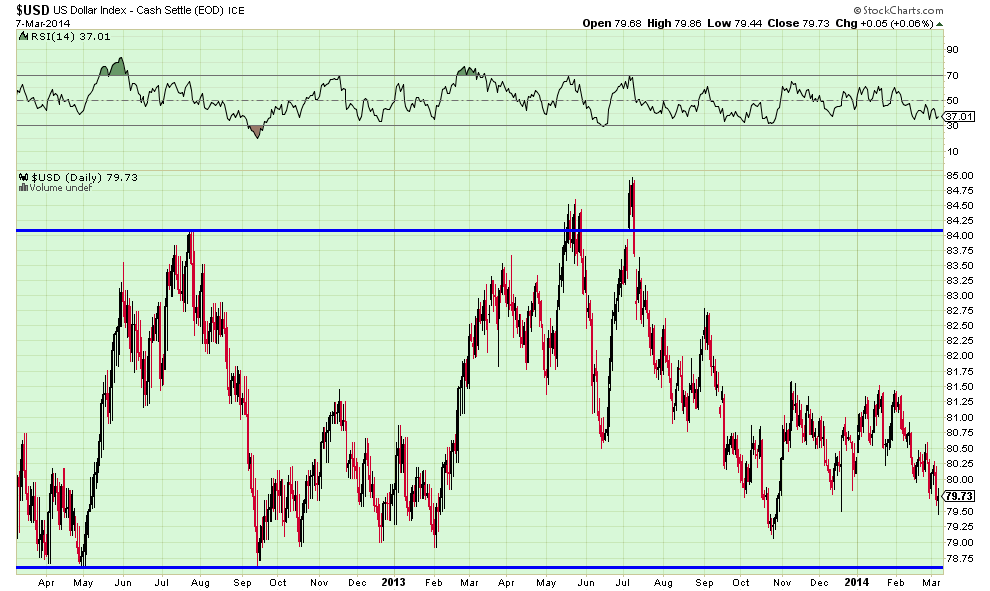
The first chart shows the range the US Dollar has been in for the last 2 years (79-84) It’s now trading near the bottom end of that range.
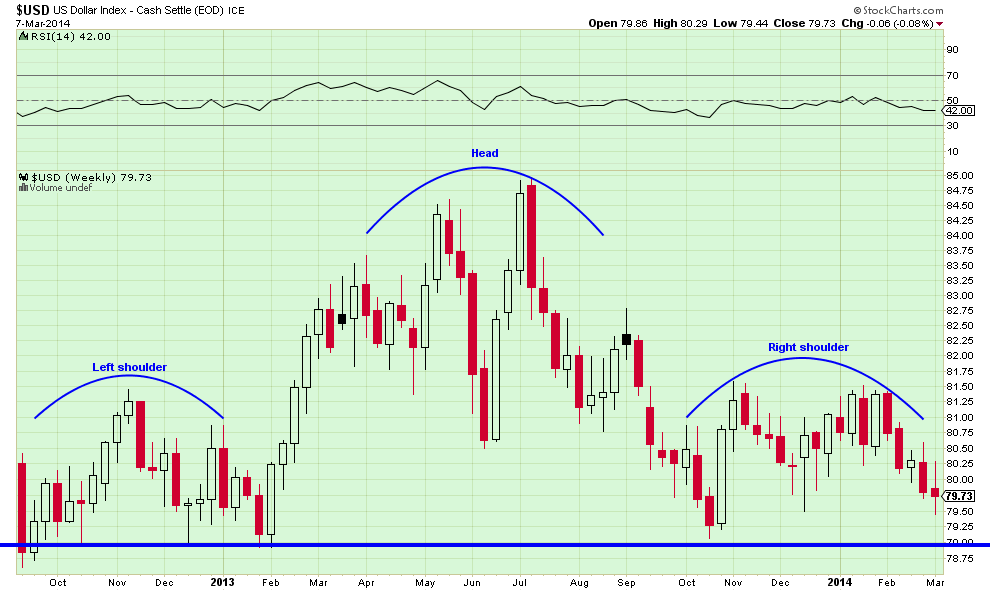
The next chart shows an interesting head and shoulders pattern with the neckline around the 79 level. A break below that neckline could send the dollar much lower.
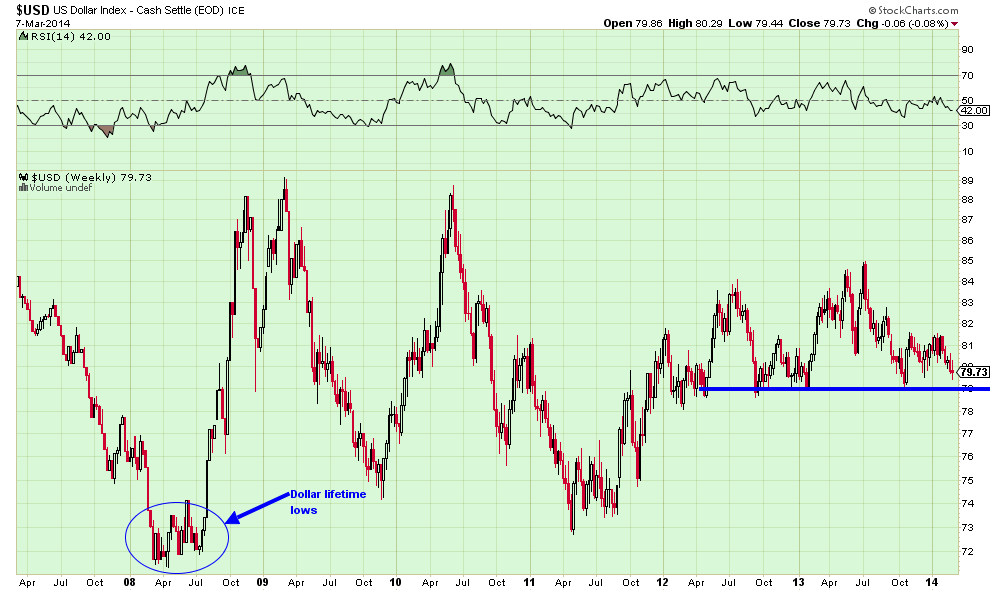
The third chart shows that lifetime lows for the US Dollar took place in 2008 just before the financial crisis… Is the Dollar gearing up to re-test those life time lows? Time will tell.
A significant breakdown in the dollar would give confirmation as to why commodities such as Corn and Crude oil and precious metals like Silver and Gold have been trending higher in 2014. But support levels, regardless of pattern, need to be respected until they fail.
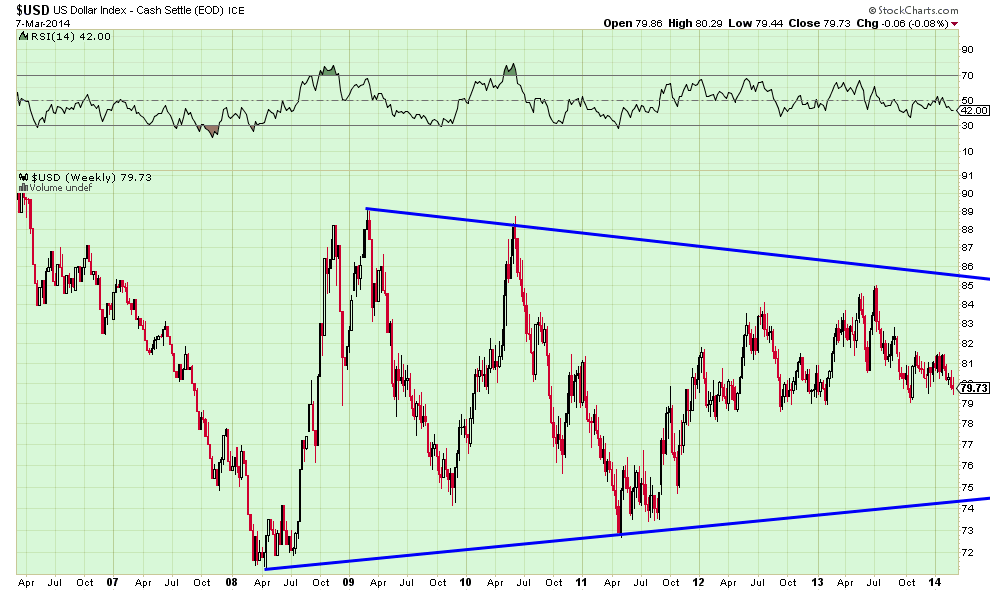
The final chart is a bonus chart, highlighting some pretty wild swings in the US Dollar over the past 8 years. That said, it appears to be coiling up for what could be a pretty substantial move down the road.
Thanks for reading.
Author is long CORN, USO and SLV via in-the-money calls at the time of publication. Any opinions expressed herein are solely those of the author, and do not in any way represent the views or opinions of any other person or entity.

: Cup (and Maybe Handle) Watch")
 Trading Near Top Of Price Range")

