The market giveth and the market taketh away. Blessed be the name of the USDA. It was an extremely tough Wednesday for Corn and Soybean Bulls following some highly unexpected yield forecasts from the USDA in the August WASDE report, which was released yesterday at 11:00 a.m. CST.
In corn the USDA estimated the 2015/16 US corn yield at 168.8 bushels per acre versus 166.8 bpa in July and the average trade guess of 164.5 bpa. As a result total US corn production increased to 13,686 million bushels, up 156 million versus July and 359 million higher than the average trade guess.
The market consensus leading up to the August WASDE report was heavily weighted toward a yield reduction and possibly of some consequence due to what has undeniably been a less than ideal growing season in the Eastern Corn Belt. Monday’s Crop Progress report reiterated this year’s challenges in the states of Illinois, Indiana, Missouri, and Ohio.
As of August 9th, Illinois’s corn crop was rated just 56% good-to-excellent versus 82% a year ago, Indiana 47% versus 72%, Missouri 51% versus 83%, and Ohio 46% versus 75%.
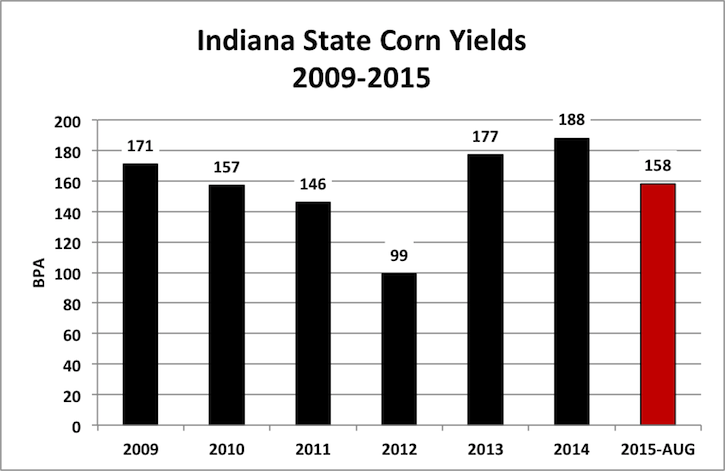
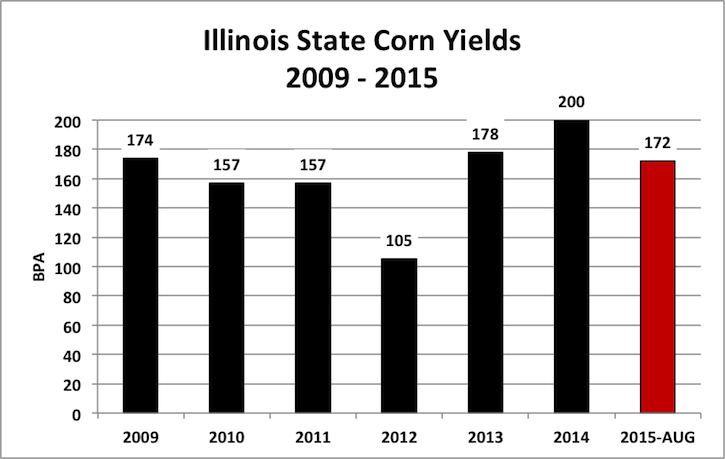
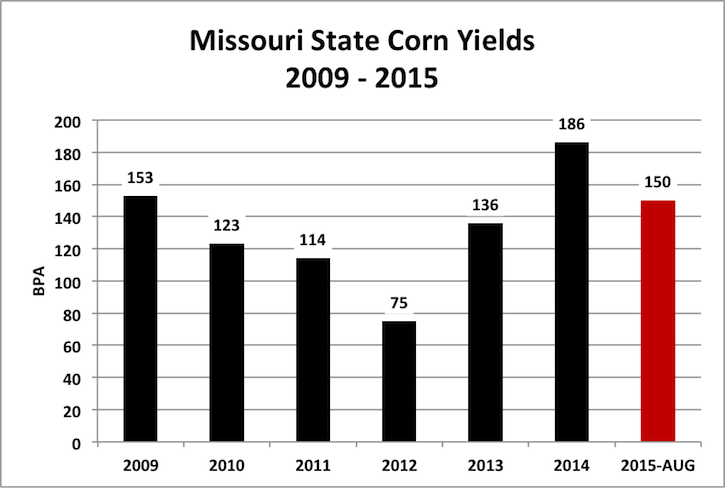
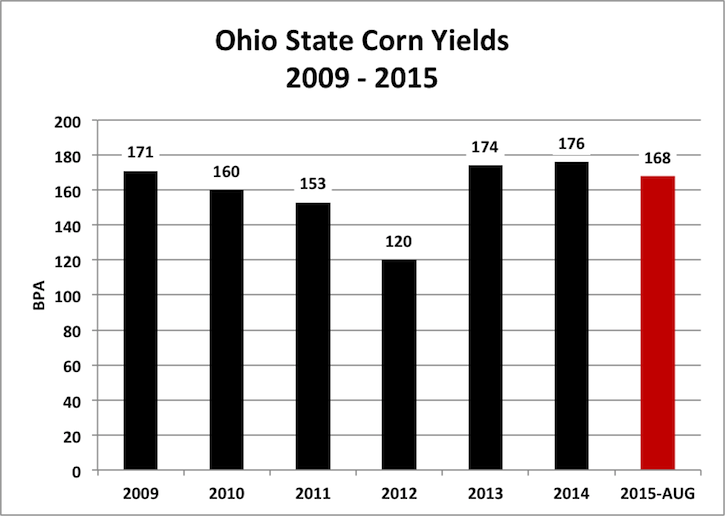
The USDA’s 2015 state-by-state yield estimates did show some significant yield declines in those particular states relative to a year ago; however I’m still of the opinion that additional decreases are pending in either the September or October Crop reports, which should contain some actual harvest results. Illinois’s corn yield was projected at 172 bpa versus 200 bpa in 2014, Indiana 158 bpa versus 188 bpa, Missouri 150 bpa versus 186 bpa, and Ohio 168 bpa versus 176 bpa.
What’s potentially misleading about the USDA’s yield decreases relative to a year ago? I alluded to this in last week’s column in that 2014 was a record corn yield year for a number of states including the aforementioned four states of IL, IN, MO, and OH. Illinois’s record yield in 2014 eclipsed the previous record by 20 bpa (previous record was 2004 – 180 bpa), Indiana’s by 11 bpa (2013 – 177 bpa), Missouri’s by 24 bpa (2004 – 162 bpa), and Ohio’s by 2 bpa (2013 – 174 bpa). Therefore 2014 in my opinion should almost be considered an outlier based on just how remarkable and unprecedented of a growing season it was. I don’t think it should be used as an accurate representation of trend of even slightly above-trend line yield potential.
On the converse, I would also consider 2012 an outlier from the standpoint of it representing one of the worst droughts in the past 100-years. Therefore if we’re to make any sort of sound comparison to the USDA’s yield estimates on Wednesday, I think we need to measure them versus the 4-year average corn yields from each of those states during 2013, 2011, 2010, and 2009. Over the course of those 4-years, the US experienced record growing conditions (2013 & 2009) to average or even slightly below average growing conditions (2011 & 2010). With that in mind I invite you to look at the table below:
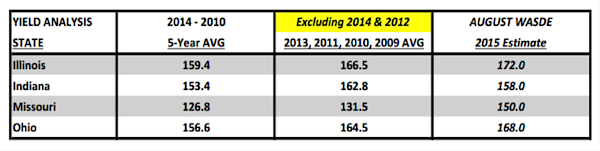
The key takeaway from the table is the comparison between the USDA’s 2015 yield estimates on Wednesday versus the 4-year averages from the crop years of 2013, 2011, 2010, and 2009 inclusive of each state’s current crop condition rating. What I see is the USDA essentially forecasting a 2015 state corn yield in Illinois that is 5.5 bpa HIGHER than the average from 2013, 2011, 2010, and 2009. Missouri’s yield is 18.5 bpa higher and Ohio’s 3.5 bpa higher. Indiana’s yield is lower but only by 4.8 bpa. Based on that analysis, I find the USDA’s latest 2015 yield estimates much harder to defend, once again taking into account just how much I’ve read and heard from first-hand accounts pertaining to the challenges in the Eastern Corn Belt, as well as, the Gov’s own Weekly Crop Progress reports.
In light of that conclusion, we’re still left with having to trade the USDA’s figures until the release of the September WASDE report at the earliest, which won’t be out until September 11th. Considering this and acknowledging that due primarily to the corn yield increase alone, US corn ending stocks jumped up to 1,713 million bushels (versus the average trade guess of 1,449 million) and World Corn ending stocks increased to 195.1 MMT (versus the average trade guess of 187.9 MMT), it’s going to be very hard in my opinion for corn to sustain rallies over the short-term in excess of $4.00 CZ5 (100-day moving average at $3.95 CZ5 probably caps recovery efforts). That said I still believe there’s an opportunity if positioned correctly to capture some upside this fall if indeed the 2015 harvest shows the yields just aren’t there in the ECB and/or harvested corn acreage is reduced due to additional drowned out acres that weren’t reflected in the June 2015 Acreage report. The USDA did NOT lower harvested acreage in Wednesday’s report; leaving it unchanged at 81.101 million acres. I’ve seen other private analysts forecasting total US corn harvested acreage at closer to 80.5 to 80.7 million acres. Therefore, it’s entirely possible CZ5 could score its harvest lows in FH September (similar to 2009) as opposed to the Oct/Nov timeframe if the market sees US corn production fall in the September WASDE report.
US SOYBEAN AUGUST WASDE REPORT SUMMARY:
In soybeans, the USDA made a similar unexpected yield increase, moving the 2015/16 US soybean yield up to 46.9 bpa versus 46 bpa in July and the average trade guess of 44.7 bpa. The result was the US soybean carryout increasing to 470 million bushels, 169 million HIGHER than the average trade guess. November soybean futures responded accordingly by closing down 61 ½-cents per bushel Wednesday afternoon and nearly challenging the June 15th contract low of $8.95 ¾. The dialogue leading up to the August WASDE report for soybeans was consistent with the expectations in corn. The vast majority of private analysts were anticipating a yield decrease due to the USDA’s current good-to-excellent rating of 63% versus 70% a year ago. Last year’s US soybean yield was a record 47.8 bpa. I’m going to put myself in the camp of those struggling with the notion that this year’s soybean yield will be less than 1 bpa below the monster yield achieved in 2014. Illinois and Indiana’s soybean crops are only rated 50% and 45% good-to-excellent respectively. Yet on Wednesday the USDA forecasted a soybean yield in Illinois of 53 bpa, only 3 bpa less than 2014, and 49 bpa in Indiana, down just 7 bpa from a year ago. Furthermore, Missouri’s soybean crop is rated just 30% good-to-excellent with Ohio’s rated 44%. Missouri’s soybean yield is currently being projected at 38 bpa versus 46.5 bpa in 2014 with Ohio estimated at 48 bpa versus 52.5 bpa last year. Those 4 states are expected to account for 31% of the US’s total harvested acreage base in 2015 (25.71 million acres). With that in mind, I’m not sure it’s possible to have a yield approaching 47 bpa nationally; if the USDA’s crop condition ratings are to mean anything.
The one positive for soybean Bulls in the August WASDE report was that World Soybean stocks fell to 86.9 MMT versus 91.8 MMT in July and the average trade guess of 89.9 MMT. Chinese soybean imports were raised to 79 MMT for 2015/16 versus 77.5 MMT in the July report. If I was to compare the better short-term, upside opportunity for a quicker recovery in either soybeans or corn I’d have to favor soybeans given just how aggressive Wednesday’s correction was in November soybean futures. I’m not ready to get overly bearish November soybeans in the low $9.00 range. Export demand remains strong for new-crop soybeans with China a very active buyer. And again…I’ll be incredibly surprised if this year’s soybean yield finds a way to come in much higher than 45 bpa by the time the dust settles from the 2015 US soybean harvest.
Thanks for reading and have a great week.
Twitter: @MarcusLudtke
Data References:
- USDA United States Department of Ag
- EIA Energy Information Association
- NASS National Agricultural Statistics Service
Any opinions expressed herein are solely those of the author, and do not in any way represent the views or opinions of any other person or entity.

: Showing Some Signs of Emerging Strength")

