US corn and soybean markets exploded higher on Tuesday following the release of the June 30th Acreage and Stocks reports. Let me start by distinguishing myself in the minority of those not fully supporting the price response in either market based on the figures the USDA released Tuesday mid-morning, which resulted in November soybeans closing up 57 ¼-cents per bushel at $10.37 ¼ and December corn closing up 29 ¼-cents at $4.31 ½. This week I’m choosing to focus on corn and will look in depth at the Planted Acreage Report and response to it.
Corn Considerations:
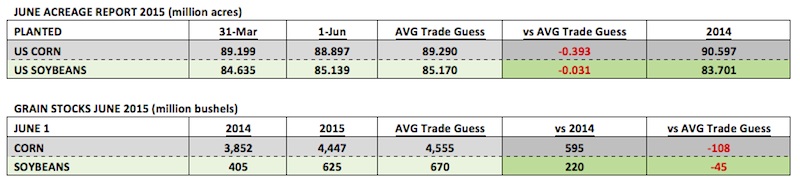
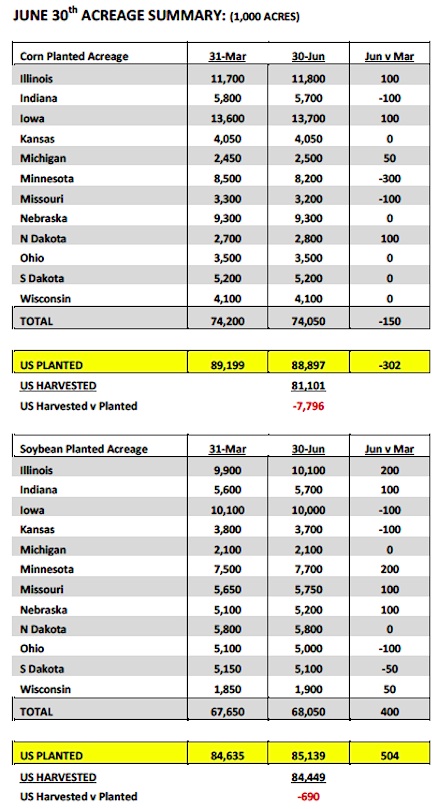
In the Planted Acreage report the USDA lowered 2015 US corn acreage 302,000 acres to 88.897 million versus the March Prospective Plantings estimate of 89.199. That figure also fell 393,000 acres below the average trade guess. What is the potential net impact on the 2015/16 US corn balance sheet inclusive of the acreage reduction? At face value assuming the USDA makes no adjustments to yield and/or total demand in the July Crop report, 2015 US corn ending stocks would fall to 1,669 million bushels versus 1,771 million in June. If the USDA also chooses to lower the US corn yield 1 BPA to 165.8 BPA (as some in the trade are suggesting due to continued corn ratings declines in Indiana and Ohio), the US corn carryout would drop an additional 81 million bushels to 1,588 million. Just how bullish of a stocks figure is this? The average US corn carryout from 2010 through 2013 was 1,042 million bushels. The average stocks-to-use ratio over that same time period was 8.3%. Even if we assume ending stocks of 1,588 million in the July Crop report that would still represent a 546 million bushel increase over the aforementioned 4-year time period and a stocks-to-use ratio of 11.5%. The other major consideration that also needs to be part of the conversation is the June 1 stocks figure, which came in at 4,447 million bushels versus just 3,852 million bushels a year ago and 2,766 million in 2013. That’s a substantial increase and once again speaks to the supply cushion in US corn inventories into and through this fall.
 If US corn stocks are still sufficient what continues to drive this market higher? I believe it’s due to a trio of factors.
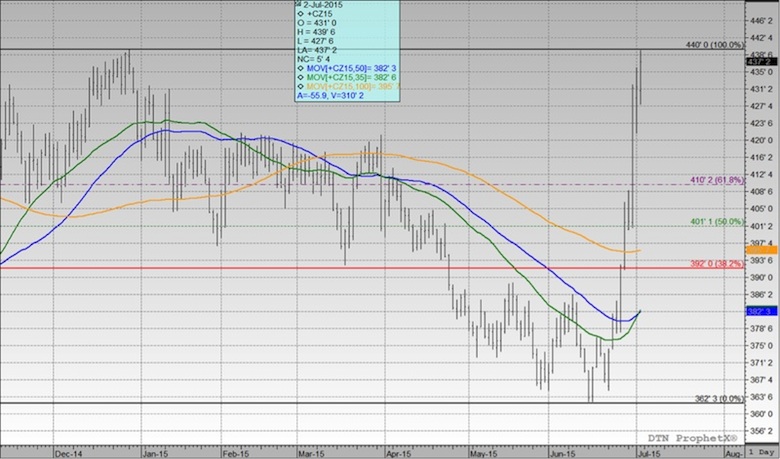
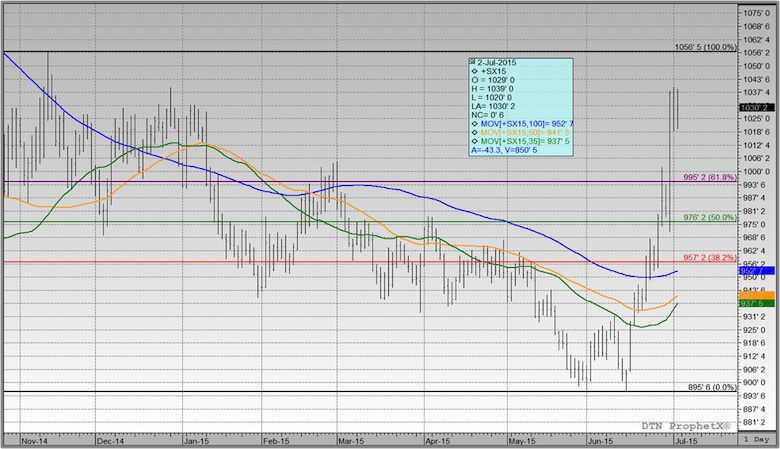
1) The money managers were still heavily net short in corn (-94,522 contracts as of 6/23) prior to release of Tuesday’s Acreage and Stocks reports. Therefore when both June corn acreage report and June 1 corn stocks report came in below the average trade guesses, the stage was set for a rush to get out even though neither figure was alarmingly bullish. Add to that the technical damage done by December corn futures closing over both the 100-day moving average and the 61.8% Fibonacci retracement, and invariably even the most ardent of Corn Bears was forced to acknowledge that momentum had shifted.
2) The November soybean/December corn price ratio had widened to 2.57 as of the close on 6/22. As of today (7/2), that ratio has narrowed to a more traditional 2.37. The debate pre-report was whether or not corn was too cheap or soybeans were too expensive given the strength in soybeans and corn’s relative inability to keep pace. Clearly the trade has since decided that corn was indeed too cheap, which ultimately has led to additional follow through support for corn even beyond Tuesday’s sharply higher close. December corn futures have continued to rally to new highs late in the week while November soybeans have essentially traded sideways.
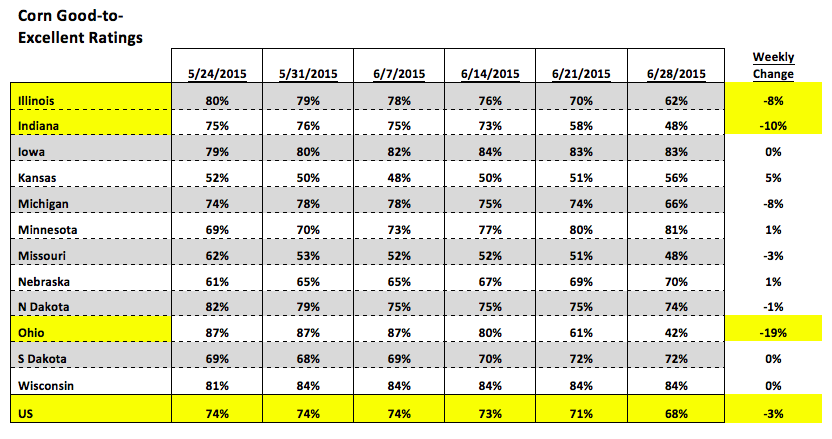
3) The real talk is centered on the US corn yield possibly falling to 160 BPA or lower. I’m not seeing or hearing anyone endorsing that type of yield cut in the July Crop report; however there are certainly those in various trade circles discussing the possibility of this over time given the crop problems in Indiana and Ohio. On Monday the USDA lowered the US corn good-to-excellent rating 3% to 68%.
Historically this is still a very strong rating. However, as is the case during most growing seasons, the trade has chosen to focus primarily on the areas of concern. This week Indiana’s corn rating fell to just 48% good-to-excellent with Ohio slipping to 42% good-to-excellent. Over the last 2-years Indiana has ranked as the 4th largest corn producing state in the country with Ohio ranked 7th. Therefore there’s no question both states have a significant impact on total national corn production and the final US corn yield. That said, in an attempt to bring some balance to this ongoing discussion, what can’t be overlooked is just how good the corn crops in the WCB are doing. Iowa, the largest corn producing state in the country with annual production doubling that of Indiana, has a corn crop that is currently rated 83% good-to-excellent. Minnesota the 4th largest corn producing state in the US has a corn crop that is currently rated 80% good-to-excellent. Illinois and Nebraska, the 2nd and 3rd largest corn producing states in the country respectively, have corn crops rated 62% (IL) and 70% (NE) good-to-excellent. Furthermore if we start to look out into the first two weeks of July, weather conditions are nearly ideal.
Is a 160 BPA yield possible? Absolutely that’s in play; however I don’t think it’s a given due to the excellent conditions in the WCB. The other measure of caution I would take before getting aggressively bullish with December corn futures approaching $4.40 is that even if the US corn yield falls to 160 BPA, the USDA is likely to offset a percentage of that yield decline with decreases to total demand. Therefore the insinuation that the US corn carryout will fall to 1,000 million bushels if this happens probably isn’t accurate. World Corn Stocks are 195.2 MMT, the 2nd largest since 1988. Also, Brazil, Argentina, and Ukraine, which represent the 3 largest non-US world corn exporters, all have sufficient corn supplies and will compete in the world export market. Domestically, the ethanol crush has been hit hard this week due to the rally in corn. Ethanol prices have not kept pace, which has pushed industry ethanol margins down to near breakeven and even slightly negative in certain areas of the country. The point being that higher corn prices comes with a cost and over time this too could have an influence on the USDA’s demand projections for feed, corn-ethanol use, and exports for 2015/16.
December Corn Prices (futures) Chart
November Soybeans Prices (futures) Chart
Next week I’ll focus on soybeans. Have a great 4th of July!
Thanks for reading and have a great weekend.
Data References:
- USDA United States Department of Ag
- EIA Energy Information Association
- NASS National Agricultural Statistics Service
Any opinions expressed herein are solely those of the author, and do not in any way represent the views or opinions of any other person or entity.


