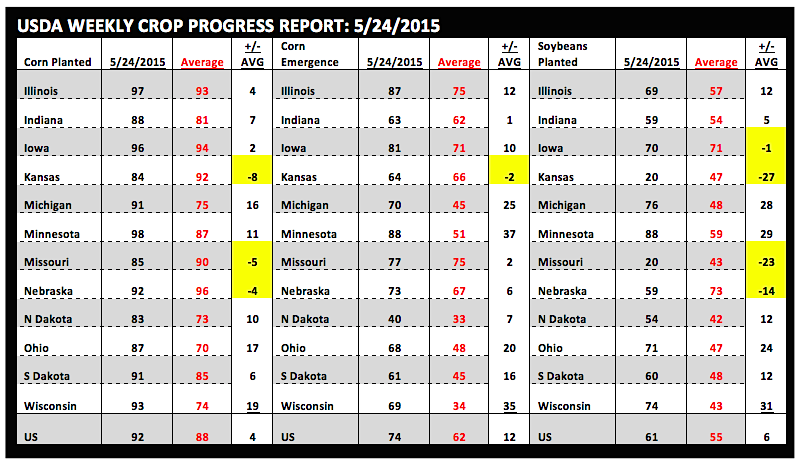
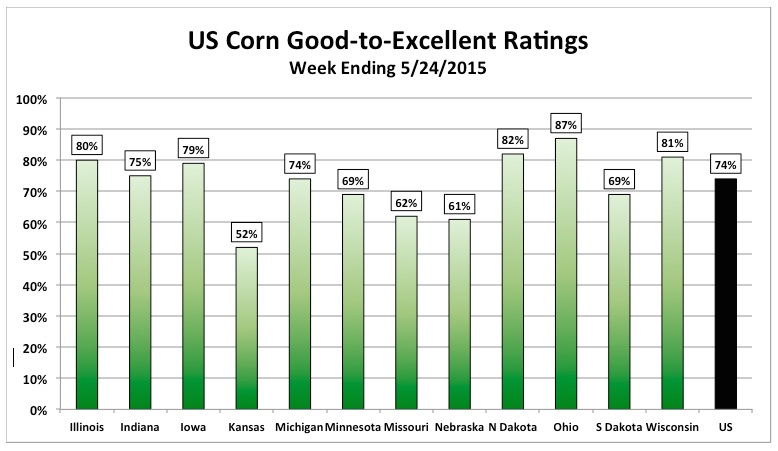
 Tuesday’s Crop Progress report was the first this year containing “good-to-excellent” ratings by state for the US corn crop. Nationally the corn crop was rated 74% good-to-excellent for the week ending May 24th, 2015. The trade was anticipating a figure ranging from 75% to 80%. I do think the number could have been higher were it not for the cool weekend temperatures, which had a pronounced influence on the appearance of corn in the northwestern Corn Belt. Nebraska’s corn crop was rated 61% good-to-excellent versus 32% fair, Minnesota 69% good-to-excellent versus 29% fair, and South Dakota 69% good-to-excellent versus 24% fair. Regardless, this year’s crop is off to a very strong start. In 2014, the first good-to-excellent rating for corn wasn’t released until June 1st, which came in at 76%.
Yields, Yields, Yields…
Going forward, last year’s weekly ratings will likely serve as the benchmark indicator as to whether or not the USDA chooses to make either upward or downward adjustments to the 2015 US corn yield in future WASDE reports, which is currently estimated at 166.8 bushels per acre. That’s going to be a heavy burden to carry considering 2014 was the banner year for US corn production. I think it’s important to note that in 2014 the US corn crop’s final good-to-excellent rating on October 26th was 74%. Therefore, incredibly there was only a 2% decline from start to finish, the byproduct of which was a final record corn yield of 171.0 BPA. However it should also be noted that in 2012 the first good-to-excellent rating for that year’s corn crop was 77%, 1% higher than the starting point in 2014. What was the final good-to-excellent rating for corn in 2012? Just 25%, which not surprisingly coincided with a final US corn yield of 123.1 BPA, the lowest national yield since 1995/96. This just reaffirms that strong early crop condition ratings can often be misleading. The primary yield determinants for the 2015 US corn crop are still 30 to 45 days in front of us. That said I would be extremely hesitant in drawing any premature yield conclusions based on early season crop condition ratings.
US soybean planting progress improved to 61% versus 55% last year and 55% on average. On a state-by-state level, the top 4 soybean producers from 2014 are all off to strong planting starts this spring. Illinois was reported at 69% planted versus 57% on average, Indiana 59% planted versus 54% on average, Iowa 70% planted versus 71% on average, and Minnesota 88% planted versus 59% on average. Collectively those 4 states accounted for 42% of total US soybean production in 2014. I think it’s relatively apparent that the lack of a significant spring planting delay continues to weigh on current soybean prices. The other negative being openly discussed in a number of trade circles is the assumption that planted soybean acreage could be raised by as much as 2 million acres in the June 30th Acreage report. This despite the March Prospective Plantings estimate of 84.635 million acres already representing a new record high for total US planted soybean acreage. That said, right now Soybean Bulls are facing a major uphill battle. The May Crop report showed 2015/16 US soybean ending stocks of 500 million bushels, the highest since 2006/07 (574 million bushels). In the spring, summer, and fall of 2006, November soybean futures broke more than a $1.00 per bushel from the May high to the September low. The current May high for 2015 November soybean futures is $9.61 ¾ (established on May 6th). At present (thru the close on 5/28), November soybean futures have already broken slightly more than 63-cents from that day high (5/28 SX5 day low of $8.98 ¼). Therefore could November soybean futures continue to work even lower? History would suggest it’s certainly possible as do the current fundamentals. I should also mention that from a global perspective, Brazil, the US’s primary world soybean export competitor, is expected to produce a 2015/16 soybean crop totaling 97 MMT. This would exceed Brazil’s current record soybean crop from 2014/2015 by 2.5 MMT, and actually put Brazil in a position to export more soybeans than the US for only the 2nd time since 2000.
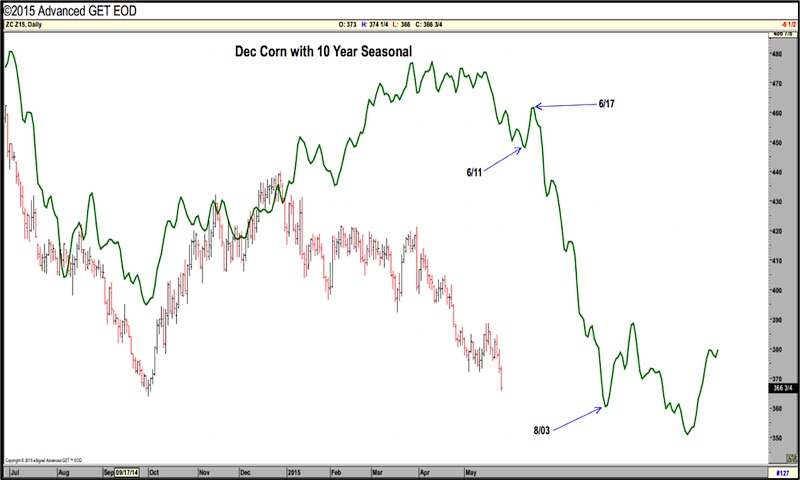
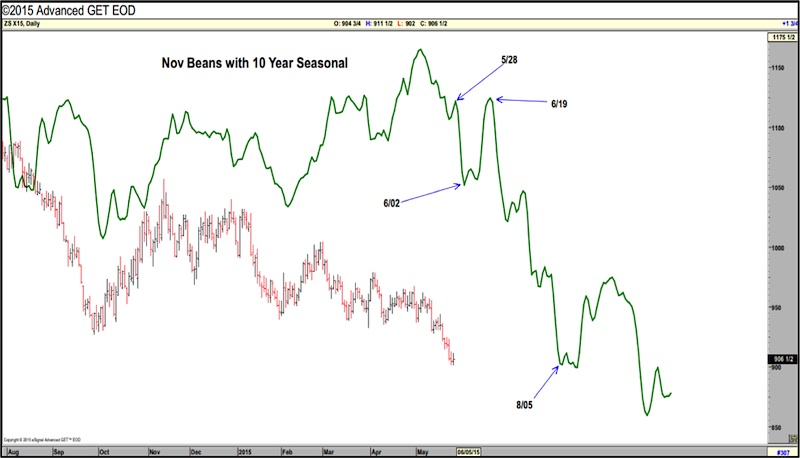
Corn And Soybeans Seasonality
I think it goes without saying that both corn and soybean futures will likely continue to struggle gaining traction until there’s a material concern about 2015 yields actually trending lower and/or a future weather event suggesting an extended period of hot and dry conditions in some of the key growing areas of the Corn Belt. That argument however, in my opinion, is going to remain a very tough sell on the part of Corn and Soybean Bulls into at least the first half of June, especially if crop condition ratings continue to hold in the mid-70% good-to-excellent level. Furthermore, technically speaking, the 10-year price seasonality for both December corn and November soybeans show continued selling pressure into the 2nd week of June as a distinct possibility. See Charts.
December Corn – 10 Year Seasonality Chart
November Soybeans – 10 Year Seasonality Chart
Checking In On Ethanol
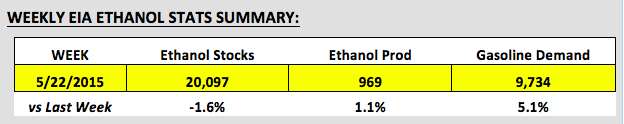
Weekly ethanol production increased for the third consecutive week improving to 969,000 barrels per day, the highest industry run-rate since the week ending January 23rd, 2015. It’s apparent the vast majority of US ethanol plants that had been experiencing some anticipated seasonal downtime this spring have now ramped back up to near full production capacity. The good news however for ethanol producers was an inventory stocks decline of 337,000 barrels, this despite the accelerated industry run-rate. Even stronger than expected gasoline demand, which totaled a very impressive 9.734 MMbpd (week-on-week increase of 473,000 bpd), proved more than enough to offset higher ethanol production. Chicago ethanol prices responded positively Thursday afternoon to the decrease in ethanol stocks, closing higher and ending approximately a 17 ¼-cents per gallon slide in ethanol values dating back to the close on May 18th, 2015.
Other Misc Charts on Corn & Soybeans
Thanks for reading and have a great weekend.
Data References:
- USDA United States Department of Ag
- EIA Energy Information Association
- NASS National Agricultural Statistics Service
Any opinions expressed herein are solely those of the author, and do not in any way represent the views or opinions of any other person or entity.

 Testing Important Price Support")
: Cup (and Maybe Handle) Watch")

