While many retail and consumer discretionary stocks have been struggling, Ulta Beauty (ULTA) has been thriving.
And it started with a strong sideways base last year when the broader market and retail sector were falling sharply.
As they say, the bigger the base, the bigger the breakout.
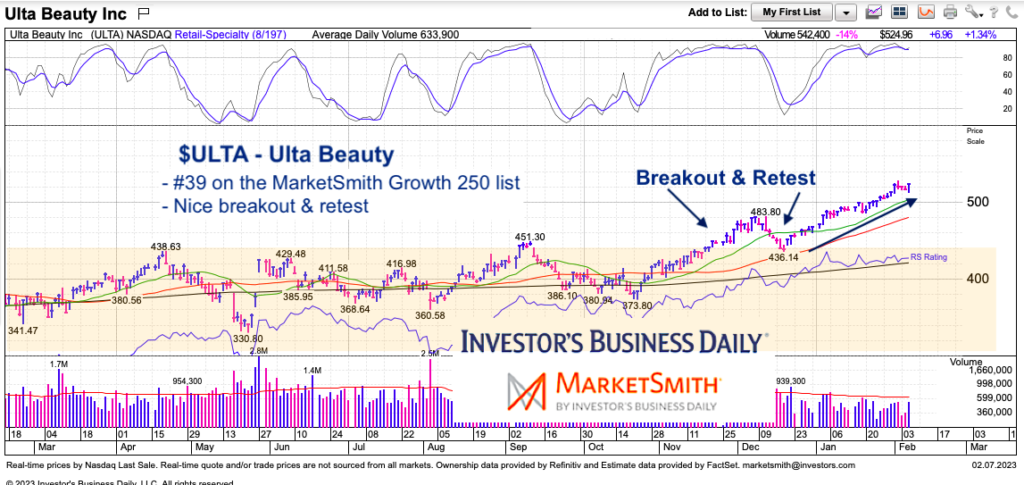
Today we keep it simple in highlight this broad base, along with a clean breakout and retest pattern on ULTA’s stock chart.
Note that the following MarketSmith charts are built with Investors Business Daily’s product suite.
I am an Investors Business Daily (IBD) partner and promote the use of their products. The entire platform offers a good mix of tools, education, and technical and fundamental data.
$ULTA Ulta Beauty Stock Chart
Before anyone is surprised, it’s worth noting that $ULTA is currently in the top 40 of MarketSmith’s Growth 250 list (a tracking service of top performing stocks). Tech has moved higher pretty fast so a pause wouldn’t be unexpected. Perhaps this is a buy the dip or pullback candidate.
Twitter: @andrewnyquist
The author may have a position in mentioned securities at the time of publication. Any opinions expressed herein are solely those of the author, and do not in any way represent the views or opinions of any other person or entity.

: Worrisome to Broader Market?")
