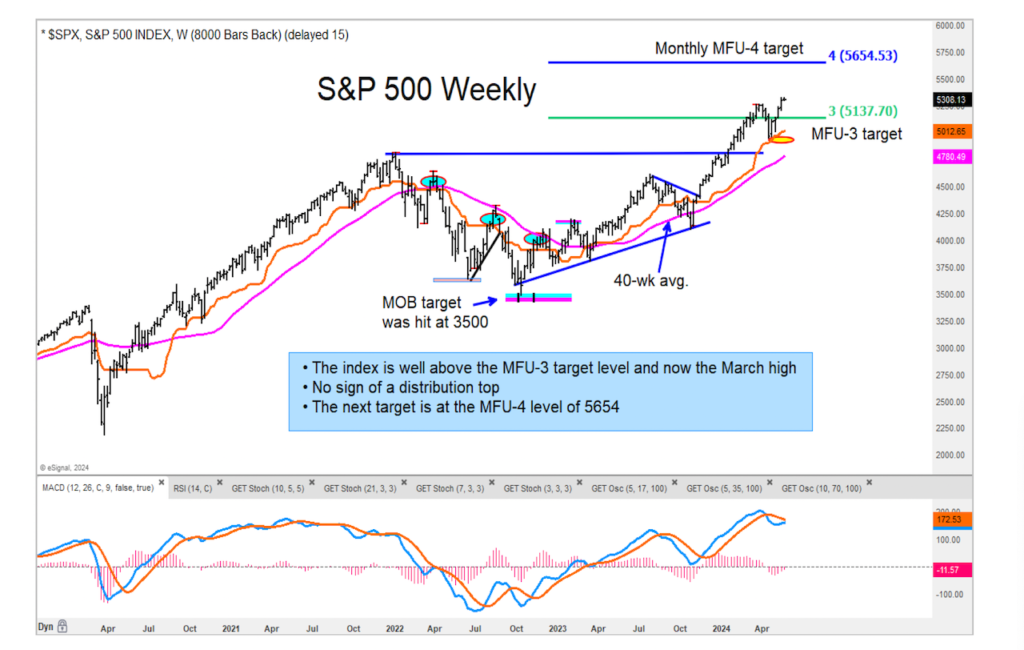
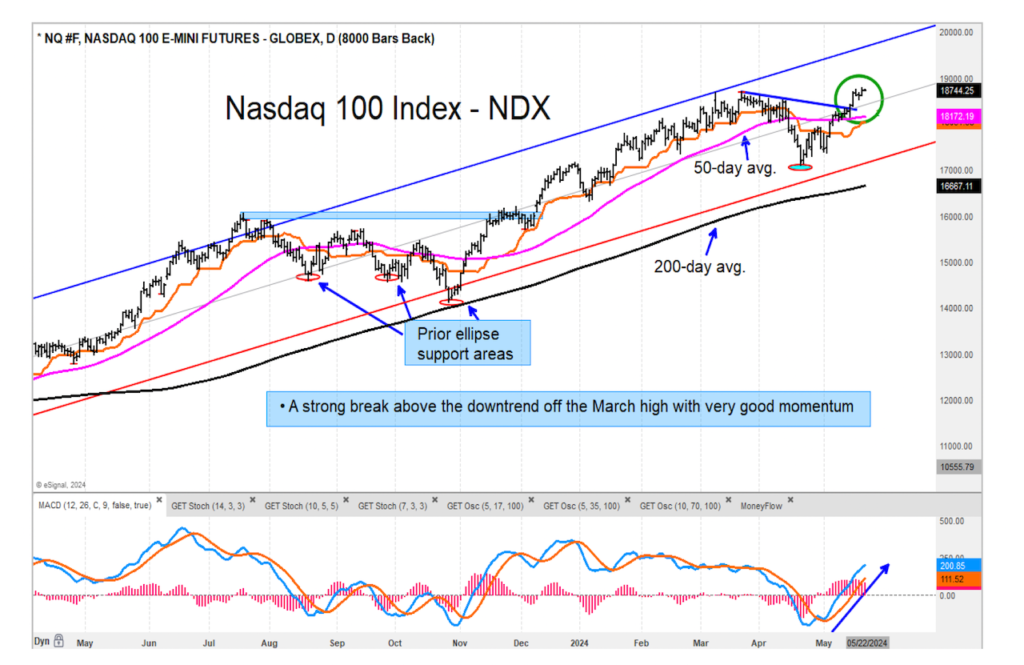
When reviewing most of the major U.S. stock market indices, you will see that despite the pullback off the March highs, they are well contained within their upward sloping regression trend channels.
What we see as a big positive is that the S&P 500, Nasdaq Composite, Nasdaq 100, and Dow Jones Industrials are above their MFU-3 price target levels. And this puts the MFU-4 price targets in sight.
Looking at the Russell 2000, this index has been in a trading range since last October and has been unable to move through the resistance areas of 2021.
The Russell 1000 Growth Index (relative to Value) looks very bullish in favor of growth. The relative chart shows the ratio pulled back to a multi-year base support and is now hooking back up.
Looking in other areas/sectors, the semiconductors (SOXX) and Technology (XLK) are in the top two spots with weekly charts reflect that bullish structure. On the opposite side of the ledger we find the Consumer Sector (XLY) and Real Estate Sector (XLRE) to be very weak relative to the S&P 500.
Twitter: @GuyCerundolo
The author or his firm have a position in mentioned securities at the time of publication. Any opinions expressed herein are solely those of the author, and do not in any way represent the views or opinions of any other person or entity.

 Testing Important Price Support")
: Cup (and Maybe Handle) Watch")

