As the stock market bounce continues, wary investors are beginning to wonder about how much longer this rally will last.
While no one can predict the future, we can utilize technical tools to gauge the health of the rally.
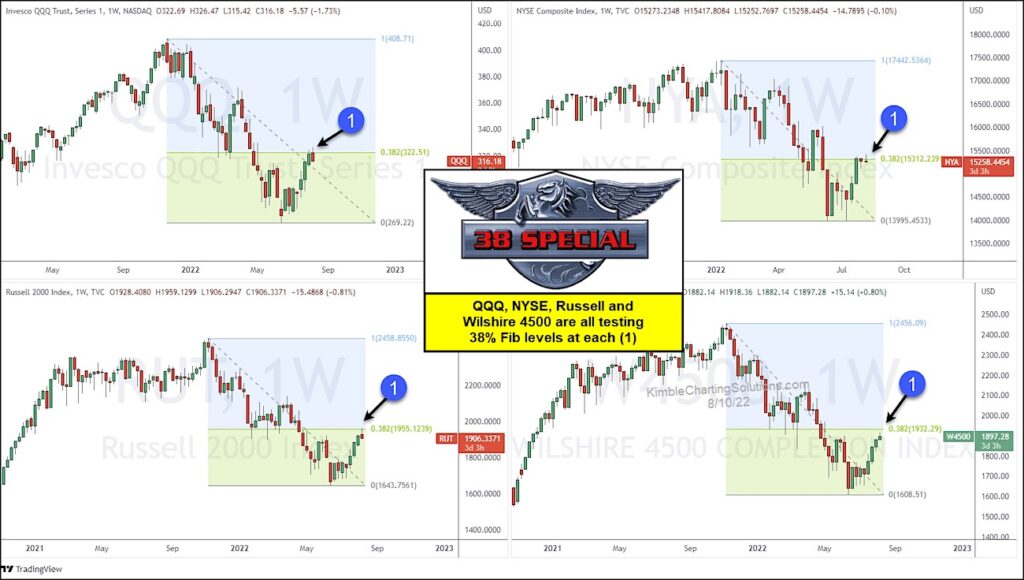
Today we highlight a key Fibonacci retracement level (38.2) and why it will likely send a big message across several key US stock market indices.
Today’s chart 4-pack includes stock indices that are facing respective 38.2% retracement levels of the downturn this year: Nasdaq 100 (QQQ), NYSE Composite, Russell 2000, and Wilshire 4500.
Bulls are hoping that we are closer to the beginning of the rally than the end. For this to be true, each of these indices will need to break out above each (1).
On the flip side, bears are hoping that the 38.2 Fibonacci level stops the rally. Either way, the results will be important to both bulls and bears. Stay tuned!
Nasdaq 100 (QQQ), NYSE Composite, Russell 2000, and Wilshire 4500 all at 38.2 Fibonacci Chart
Note that KimbleCharting is offering a 2 week Free trial to See It Market readers. Just send me an email to services@kimblechartingsolutions.com for details to get set up.
Twitter: @KimbleCharting
Any opinions expressed herein are solely those of the author, and do not in any way represent the views or opinions of any other person or entity.

: Cup (and Maybe Handle) Watch")
 Trading Near Top Of Price Range")

