The past month has seen assets gain in price, despite an increase in investor anxiety due to comments from the European Central Bank (more on that below).
In the U.S., tweets continue to be plentiful while new legislation remains scarce. Yet despite these interesting times, the economy continues to grow and add jobs.
Stocks & Bonds
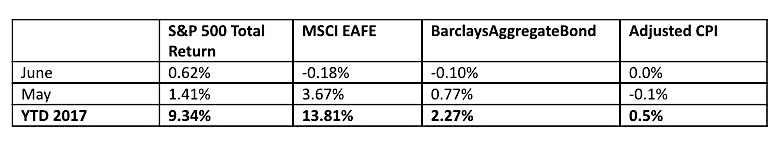
The S&P 500 Index (INDEXSP:.INX) continues its upward trajectory. The market was reminded of the importance of global central banks when the ECB talked about winding down purchases. That immediately put a damper on bond prices, not just in the EU, but around the world. It also hurt European stocks temporarily. Generally speaking, corporate earnings are boosted by low interest rates and hurt by higher ones.
Here are the numbers:
Commodities & Currencies
Crude Oil prices continue to toil, posting losses of nearly 5% last month (and trading sideways thus far in July). OPEC is continuing to engage in saber-rattling to try to boost prices. However, global inventories remain near record highs, and price speculators remain wary of American shale producers adding more supply to an already over-supplied market. Meanwhile gold is drifting…
The U.S. dollar continues to struggle as well. The currency market is apparently more bearish on the U.S. economic recovery than the stock market, and is essentially saying that the Fed is just about done with hiking rates for a while.
Economy
The ISM Manufacturing PMI in June came in at 57.8%, the 97th straight month of economic expansion. The non-manufacturing, or services, index came in at 57.4%, also showing continued expansion. The Commerce Department released its third estimate of first quarter growth, with yet another increase to 1.4% (up from the first and second estimates of 0.7% and 1.2% respectively). According to the Bureau of Labor & Statistics, the unemployment rate ticked up slightly to 4.4% in June, as a result of more individuals entering the work force than jobs were created.
The National Association of Realtors reports that existing-home sales in May 2017 were 2.7% higher than in May 2016. In addition, the median price increased 5.8% to $252,800. Median home prices have now been rising for the past 63 months. Distressed sales (foreclosures and short-sales) were just 5% of total sales in May, down from 6% a year ago.
Commentary
The S&P continues to post new highs, earnings projections continue to rise, and everything looks rosy for equity bulls. Here is a chart that is full of contrarian cold-water:
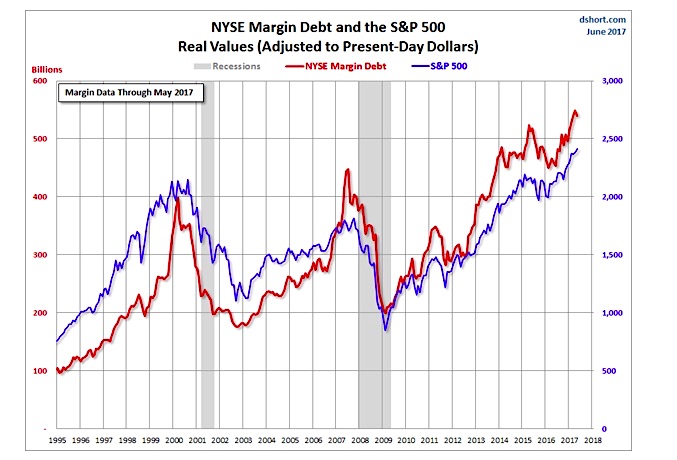
Margin debt is not something most individuals will use – borrowing money to buy stocks involves too much risk. However, there are hedge funds and other institutional investors who utilize margin debt in aggressive investment funds. They are true market-timers, and because of the debt in their strategies they can carry tremendous leverage. A 5% gain the S&P 500 for a retail investor might look like a 25% gain for a leveraged investor – and the inverse is also true.
So the amount of margin debt outstanding is an important piece of information in the overall conversation about the stock market. Current levels look awfully high. Indeed, peak levels of debt in 2000 and 2008 both presaged large market downturns. This is because the more leverage there is in the market, the more stock market gains are dependent on day-traders, and the more shares have to be sold quickly if the market dips. A 5% sell-off could spark much bigger selling not for fundamental reasons, but simply to cover margin calls.
This chart is certainly a little scary, and almost seems to predict a stock market crash. Let me be clear – I am not predicting a stock market crash. There are many differences between 2000 and 2008 and today. For one, prevailing interest rates in 2000 were about 6%, rates in 2008 were 4.5%, and today they are just 2.5%. So although the ‘mortgage’ is bigger than ever, the monthly payments are actually a bit smaller than they were in 2000 and 2008 because of the lower interest rate. So the market could continue to move higher, of course. Personally, I would not put much money on that thesis.
I think any prudent, long-term investor would continue to be somewhat skeptical of the gains in the S&P 500, and would continue to keep a balanced portfolio that holds bonds in the event of a stock market downturn. In addition, I think it behooves investors to look for stocks outside the S&P 500 that might be less exposed to any downturn.
Data Sources:
www.standardandpoors.com – S&P 500 information
www.msci.com – MSCI EAFE information
www.barcap.com – Barclays Aggregate Bond information
www.bloomberg.com – U.S. Dollar & commodities performance
www.realtor.org – Housing market data
www.bea.gov – GDP numbers
www.bls.gov – CPI and unemployment numbers
www.commerce.gov – Consumer spending data
www.napm.org – PMI numbers
www.bigcharts.com – NYMEX crude prices, gold and other commodities
https://www.advisorperspectives.com/dshort/updates/2017/06/27/a-look-at-nyse-margin-debt-and-the-market – margin debt illustration


