Key Takeaways: Rally off of December lows is encouraging, but has not been tested for strength.
Weekly trends remain challenging in U.S. but are improving overseas. Small-caps not showing leadership. Optimism is being rebuilt.
U.S. Equities Outlook Into Early February
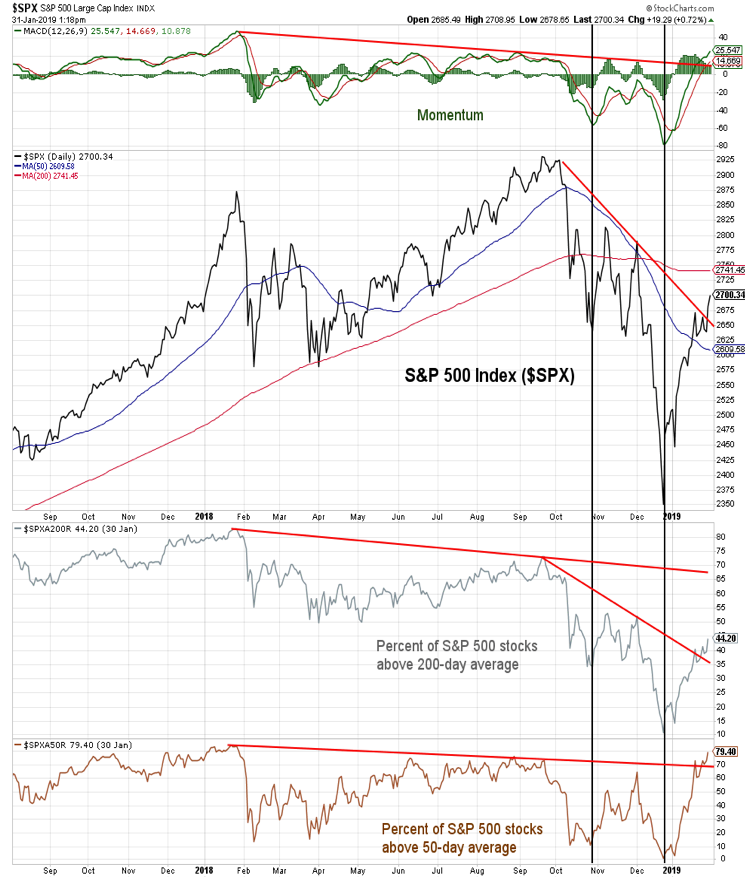
Stocks have rallied in January (S&P 500 is up nearly 8% for the month and now 15% above its Christmas Eve low). The price rally has been accompanied by improving momentum on the daily chart and an expansion in the percentage of stocks trading above their 50-day and 200-day moving averages.
In the case of momentum and the percentage of stocks trading above their 50-day averages, the January gains have broken above down trends that were established off of the January 2018 peaks. To some degree, the strength in January is reflective of the weakness in December.
While the bounce back is encouraging, the resilience of the move has yet to be tested. A pullback that establishes a pattern of higher lows would provide conviction that the trend has indeed shifted.
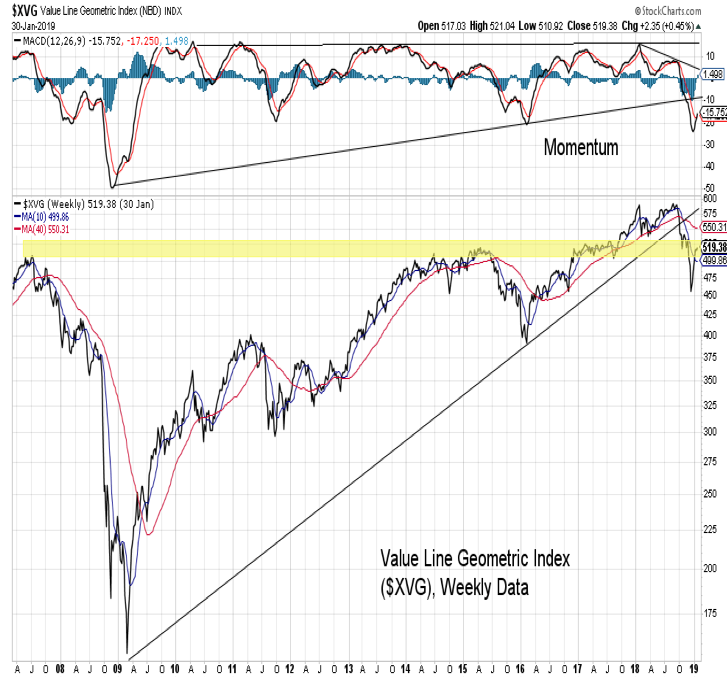
While the daily chart provides some reason for encouragement, the weekly charts for U.S. stocks provide more caution. The breakdown in both price and momentum trends that were seen in the fourth quarter of 2018 appear meaningful from a longer-term perspective, and the early strength in 2019 has yet to resolve this weakness. After declining more than 25% in late 2018, the Value Line Geometric Index has rallied in early 2019 but now finds itself in an area of resistance. The breakdown in momentum is still a headwind.
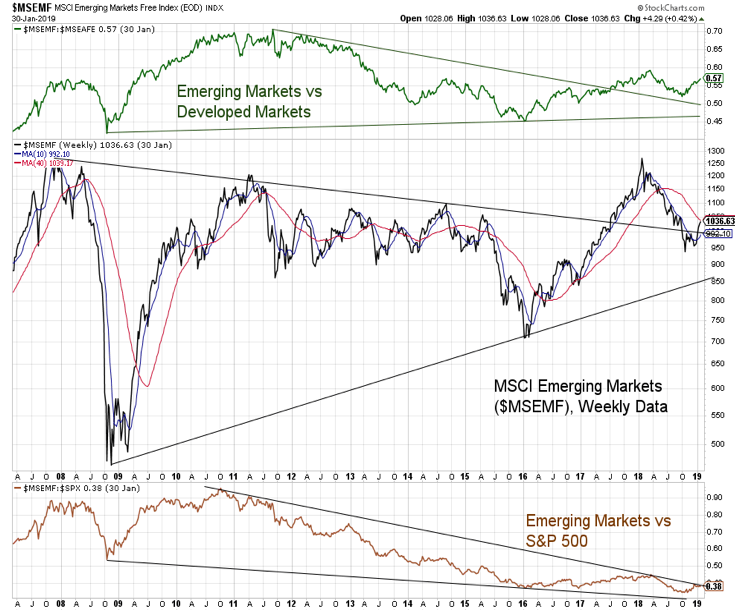
International stocks fared somewhat better than U.S. stocks in the fourth quarter of 2018, but that is largely due to the weakness they had endured over the first three quarters of the year. Emerging Markets pulled back in 2018 to test an extension of a down-trend line that stretches back a decade. On a relative basis, Emerging Markets are gaining strength relative to both Developed Markets and the S&P 500. With the deterioration in the longer-term trends in the U.S. and improvements in Emerging Markets, the relative strength trend could see a meaningful shift toward Emerging Market leadership for the first time in nearly a decade.
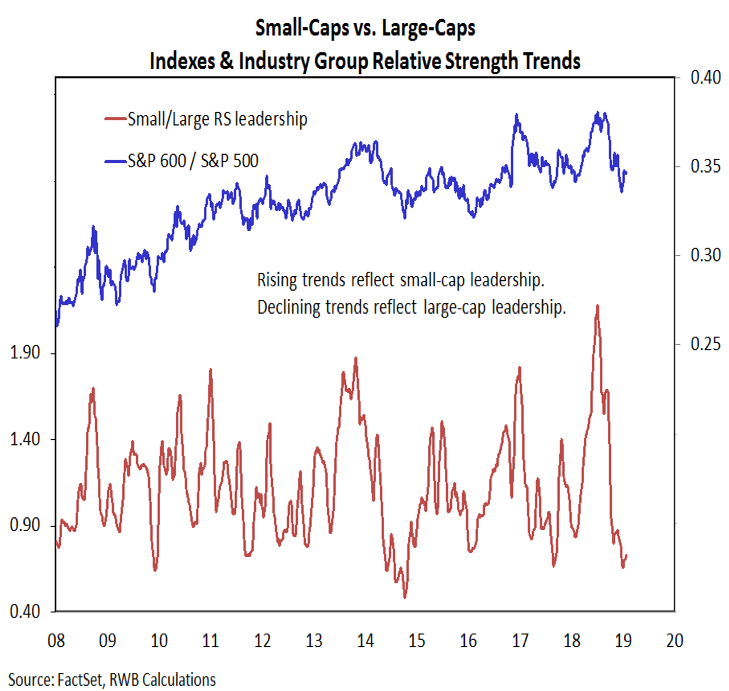
Small-cap stocks remain relative laggards versus their large-cap counterparts. This can be seen in both the ratio between the indexes (S&P 600 versus S&P 500) as well as the industry group relative strength rankings. The lack of small-cap leadership is one reason we have been somewhat skeptical of seasonal studies that argue for sustained strength in the first half of 2019.
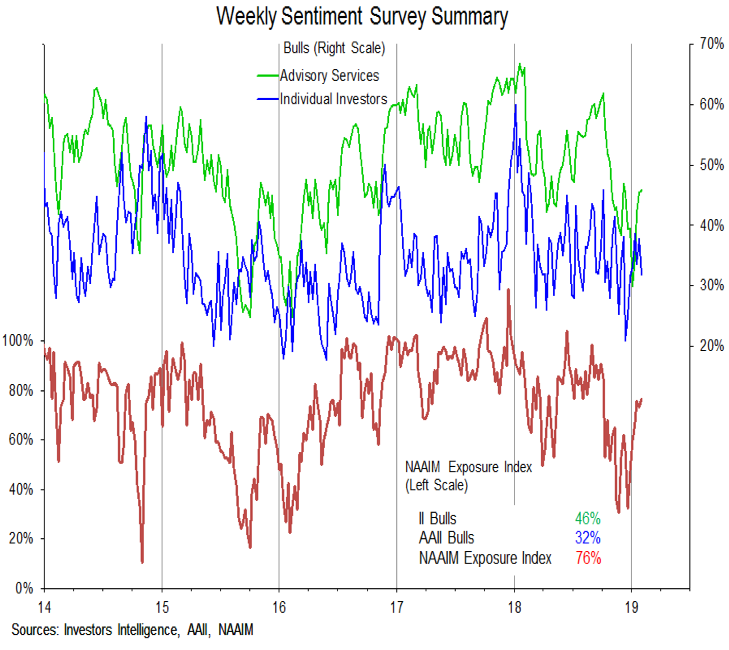
We continue to watch the sentiment indicators for evidence that the fear and concern that was present (however briefly) at the end of 2018 has been replaced by optimism and complacency. Bulls on the Investors Intelligence survey have climbed back to 46% (and the bull-bear spread on that survey is back above 25%). The AAII survey, however, shows an even split between bulls and bears (both at 32%). The NAAIM Exposure index, now at 76%, shows a return to optimism.
From a shorter-term perspective, the NDR Trading Sentiment Composite is at the high end of the neutral zone and is at its highest level since early October. Optimism is not yet excessive, but it is moving in that direction.
Twitter: @WillieDelwiche
Any opinions expressed herein are solely those of the author, and do not in any way represent the views or opinions of any other person or entity.


 Ready To Break Out?")


