The S&P 500 (NYSEARCA: SPY), Dow Jones Industrials (NYSEARCA: DIA) and the NASDAQ Composite (NYSEARCA: QQQ) broke a two-week winning streak last week declining nearly 2.00% in another volatile week for stocks.
Stocks are now in a historically strong seasonal period that extends well into January.
Nevertheless, the chain of events that sparked the October decline remain unresolved. The markets continue to grapple with the great news of outstanding third-quarter earnings that have surged 25.8% from a year earlier versus rising interest rates, trade concerns, and slower growth abroad.
Oil prices slid for the sixth consecutive week amid fears of slowing global demand. Global economic worries increased last week as the British pound dropped sharply on Thursday. Germany and Japan’s economies contracted and China’s growth rate slowed.
While our economy is on solid ground, U.S. businesses will need healthy foreign markets in order to maintain a strong growth rate. The focus over the next few weeks will be the G20 Economic Summit on November 30 and the Federal Reserve meeting on December 16.
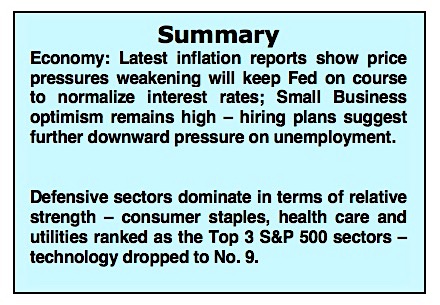
Analysts are expecting the Federal Reserve to raise short-term interest rates. Since the beginning of September, we have advised our clients to stay with the strongest sectors, especially the defensive sectors of utilities and consumer staples, which are currently among the top-performing S&P 500 sectors.
The technical indicators for the stock market argue that investors maintain a cautious approach. The trend in the popular averages turned down in October and currently the S&P 500, the S&P Mid-Cap, Russell 2000, the NASDAQ and NY Composite indices are below their 50- and 200-day moving averages.
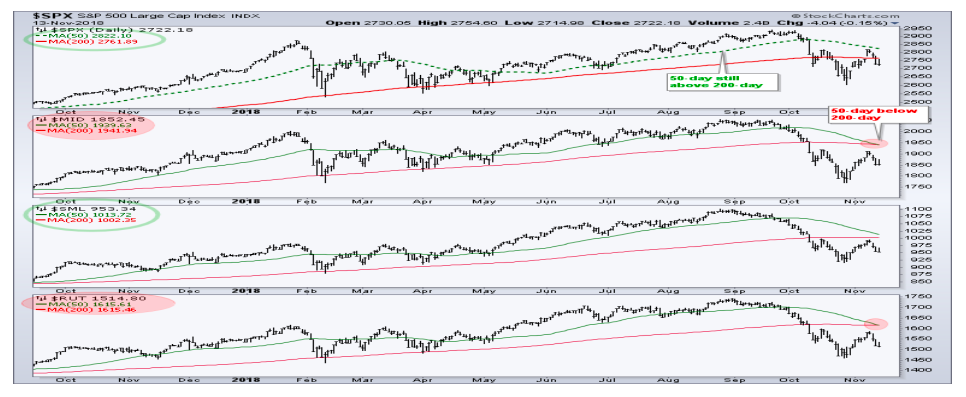
Nearly all global stock markets are also in defined downtrends. Historically, the broad market leads the popular indices by three to six months or more and, therefore, should be the focus of attention. Signs of breadth improvement are likely to show up first in the performance of small-cap stocks.
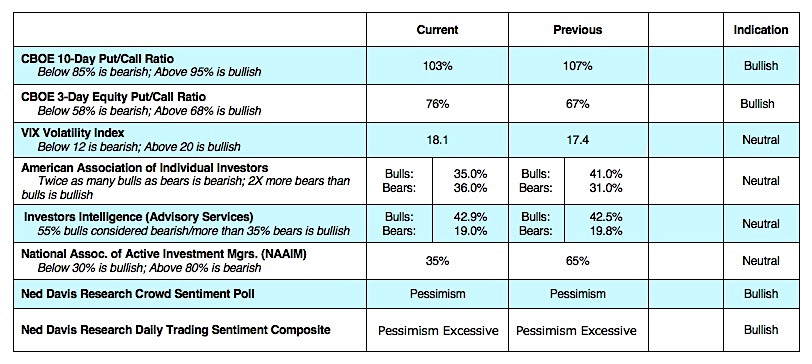
Before a sustainable rally can be anticipated, the Russell 2000, which typically plays a leadership role in a year-end rally, should begin to outperform. A solid bottom should also include a rise in volume, an oversold condition, excessive pessimism and one or two sessions where upside volume overwhelms downside volume. According to Ned Davis Research, Thanksgiving week has seen the market higher 75% of the time. The best gains historically occur on Wednesday and Friday with a let-down on the following Monday.
![]()
Twitter: @WillieDelwiche
Any opinions expressed herein are solely those of the author, and do not in any way represent the views or opinions of any other person or entity.


