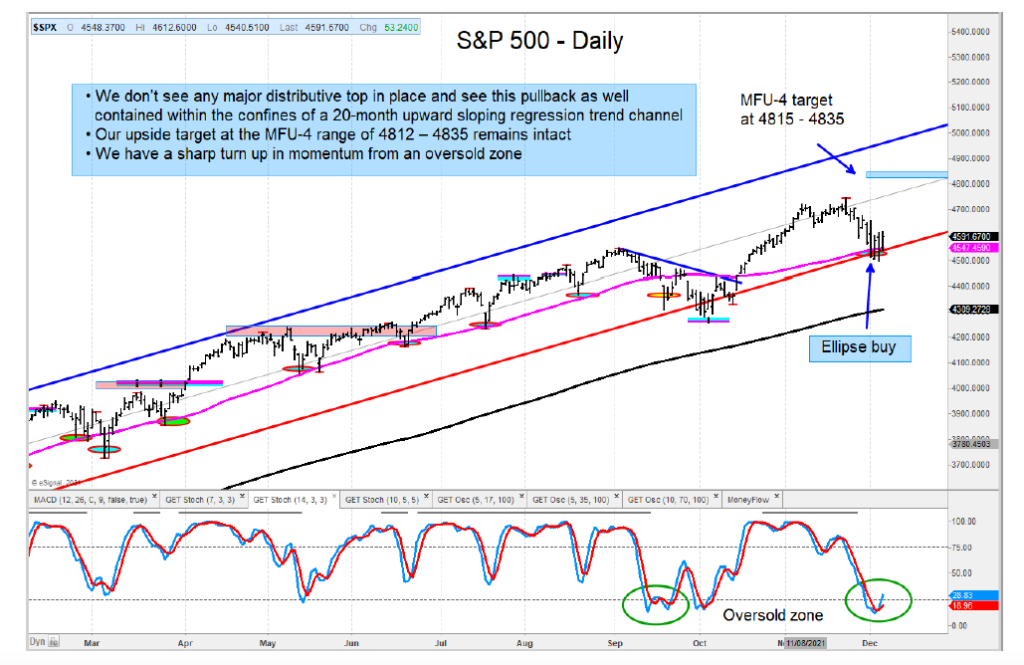
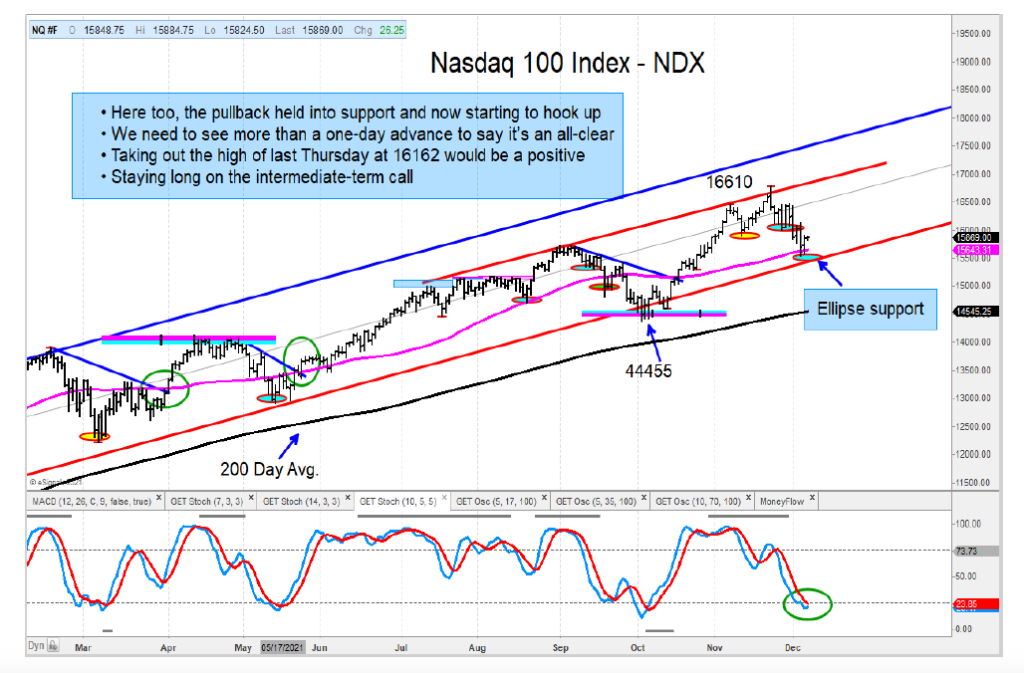
The recent pullback in both the S&P 500 and Nasdaq 100 Indices looks to be a buyable pullback into support.
Both indices have held and turned up from their respective 50-day moving averages and the lower end of their intermediate-term regression trend channels.
They have also turned up from ellipse buy signals.
For the S&P 500, we get upside in the 4815—4835 area.
The Nasdaq 100 has a buy setup and we would be adding on weakness with a stop at recent lows. Our upside price target is 16800.
The Russell 2000 pulled back deeper than the other indices and is holding above its 11-month support area. Momentum is neutral so we will wait until it cycles higher.
WTI Crude Oil undercut a MOB support band but held at a Money Flow Unit (MFU) – 3 based on the October-November highs. An MFU-3 level is a buy level in our work. Our long-term price target of $88.25 is what we are looking for. Some equities that score well with our analysis and we are watching in the space are $FANG, $DVN, $PXD, $AR, $WLL, $COP, $LPI, $EOG, and $HES.
The author or his firm have a position in mentioned securities at the time of publication. Any opinions expressed herein are solely those of the author, and do not in any way represent the views or opinions of any other person or entity.


 Ready To Break Out?")


 Rolling Over At Key Fibonacci Level?")
