The Dow Jones Industrial Average (INDEXDJX:.DJI) continues to lead the charge, gaining 2.00% last week with the S&P 500 (INDEXSP:.INX) gaining 0.86% and the NASDAQ (INDEXNASDAQ:.IXIC) 0.35%, respectively. This week began with a minor selloff on Monday but by and large, investors have been buyers into third quarter earnings.
The equity markets are being supported by stronger-than-expected third quarter earnings and improving U.S. economic conditions and stronger global growth.
Investors appear to be motivated by the prospects for tax cuts for individuals and corporations. It is estimated that if corporate taxes are reduced to 20% it could translate into an increase in S&P 500 earnings of more than 10% and have more than twice the effect on small business. The markets are also focused on the potential for more than $2 trillion parked overseas to return home as the tax rate falls from 35% to 10%. Entering the new week the S&P 500 Index is poised to set a new record by going more than 241 days without experiencing a 3.00% decline.
Although a pullback is overdue it may be postponed until the tax bill is actually passed. This would fit the often proven Wall Street rule that states that investors buy the rumor and sell the news.
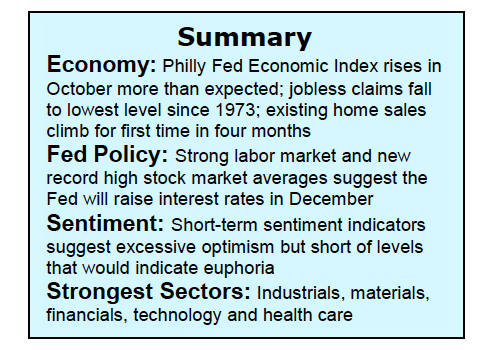
The financial sector moved into the top spot in terms of relative strength within the S&P 500. This has bullish ramifications for the economy and equity markets but is a negative for the debt markets as it suggests interest rates are likely to move higher.
Despite the unrelenting rise in stock prices without a meaningful correction, the technical indicators offer little evidence of an impending peak in the market averages. Most equity indices are in harmony with the primary trend and argue that the path of least resistance remains to the upside. Breadth indicators remain bullish overall. The percentage of industry groups within the S&P 500 that are in defined uptrends improved to 78% from 75% the previous week.
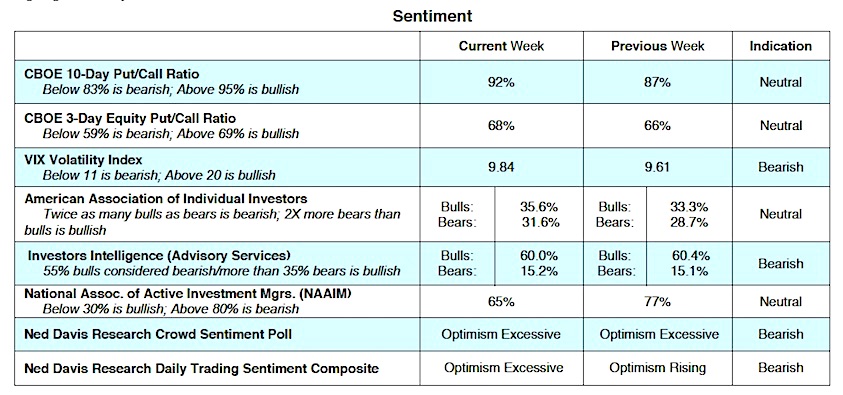
The largest concern in the breadth data is the substantial drop in stock market volume. Volume is down 12% in the third quarter relative to this year’s average. This is not viewed as an immediate threat but could be an issue if volume continues to contract as volume historically precedes price. Sentiment measures suggest extreme optimism is present but short of the euphoria that is often found at important stock market peaks. Investors Intelligence, which tracts the opinion of Wall Street letter writers shows optimism is near a 12-month high with the percentage of bears the lowest since 2015. Investor sentiment indicators suggest stocks could move lower before heading higher into year end.
Thanks for reading.
Twitter: @WillieDelwiche
Any opinions expressed herein are solely those of the author, and do not in any way represent the views or opinions of any other person or entity.


