 The corn market traded on both sides of unchanged this week with the back and forth price action appearing to be somewhat indicative of the same uncertainty surrounding the size of this year’s US corn crop on the part of both money managers and end users.
More and more private crop analysts are becoming increasingly outspoken as to their stated opinions on the direction of the US corn yield, which as of the July Crop report was unchanged versus a month ago at 166.8 bushels per acre. With the calendar suggesting that the key corn pollination window is now upon us, the stakes invariably get higher, especially with the managed money net long in corn now seemingly banking on a yield reduction of some consequence in the August Crop report. That said traders are well aware that weather during pollination, and specifically the importance of timely rains and cool nighttime temperatures, historically is the driving force behind determining final US corn yield potential.
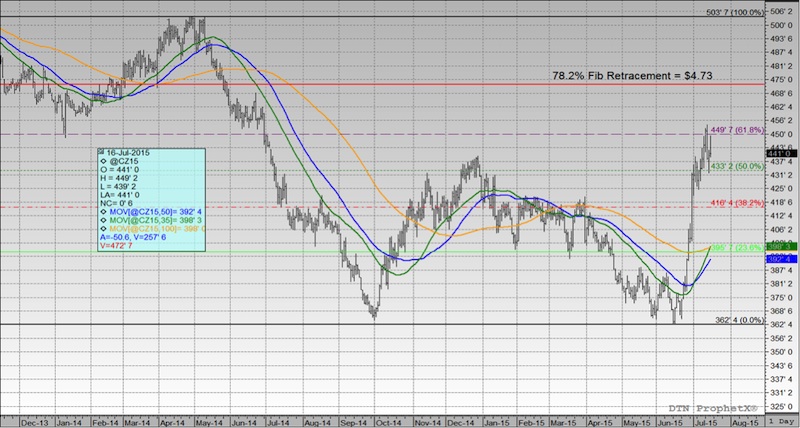
December Corn Prices (futures) Chart
Right now I’m seeing considerable debate on both sides of the yield discussion; however as is often the case every year, nearly everyone’s opinion appears to be influenced by where they call home. I’ve found that even the most consistent and emotionally detached traders (which I consider a strength when making buy/sell decisions) struggle to get beyond the view from their own “backyard.” Considering this, what type of US corn yield is the corn market currently trading? In publication, the range seems to be approximately 163 to 165.5 bpa. However privately, “water cooler” speculation has the US corn yield drifting closer to 160 bpa. This holds especially true for those traders taking up residence in the Eastern Corn Belt where states such as Illinois, Indiana, and Ohio continue to suffer from excessive precipitation and deteriorating crop conditions.
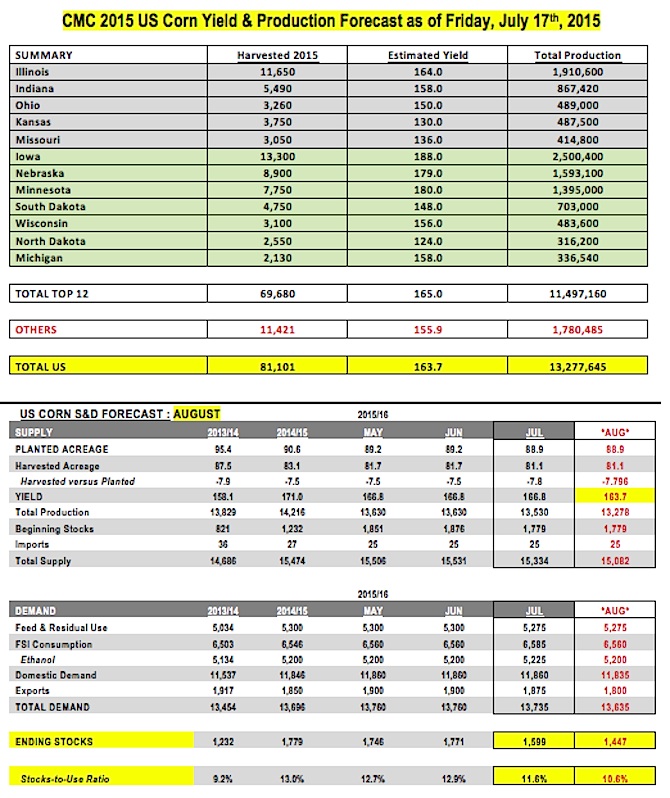
Knowing this, is there a way to project a current US corn yield that goes beyond a simple guess based primarily on “feel” or subjective observations? With that as my challenge, this week I chose to go state-by state in the top 12 corn producing states in the US to try and create a production forecast that was based more on analytics. To do this I analyzed each state’s current crop condition rating and recent yield history, as well as, the USDA’s June harvested acreage projections. To begin, I separated the top 12 states into two sub-categories. The first category representing those states likely to experience final corn yields below-trend line. The second being those states likely to achieve final corn yields at or above-trend line. The following is a summary of my findings and opinions as of the most recent Weekly Crop Progress report issued on Monday, July 13th:
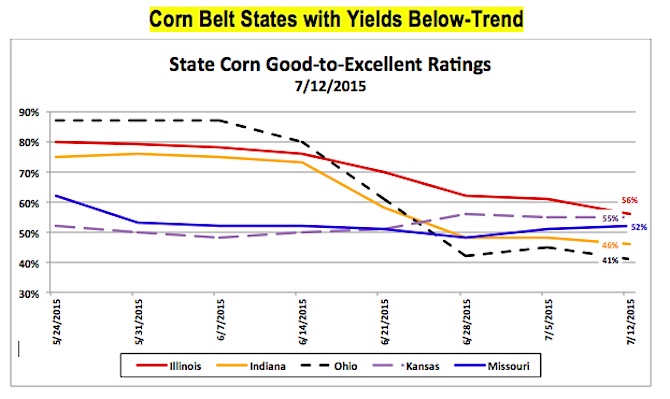
CORN BELT STATES WITH YIELDS LIKELY BELOW-TREND: ILLINOIS, INDIANA, OHIO, KANSAS, MISSOURI
- There are currently 5 states that I believe most in the market would agree are likely to see their final state corn yields drift below-trend line in 2015, those being Illinois, Indiana, Ohio, Kansas, and Missouri. Of those 5 states, Illinois currently has the highest good-to-excellent rating at 56% with Ohio holding the distinction of the lowest good-to-excellent rating in the group at just 41%. On average over the last 2 years, those 5 states have accounted for 35.5% of total US corn production. Illinois is arguably the biggest swing state in this sub-category given its standing as the 2nd largest corn producing state in the country. In 2014, Illinois’s corn crop swelled to 2.35 billion bushels via a yield of 200 bushels per acre on harvested acreage totaling 11.75 million acres.
- Based on each state’s most recent good-to-excellent rating, along with its 2 and 5-year yield history, I estimated each state’s current corn yield for 2015 at the following: Illinois 164 bpa, Indiana 158 bpa, Ohio 150 bpa, Kansas 130 bpa, and Missouri at 136 bpa. Illinois once again stands out among the other 4 states given its singular ability to materially move the needle on the national corn yield average due to its acreage base and production potential. At 164 bushels per acre I attempted to take into account the average yields in Illinois in 2010 and 2011, which averaged 157 bpa under less than ideal growing conditions. If you were to compare the 164 bpa yield versus Illinois’s 2-year average, it would reflect a yield that is 25 bpa below the 2-year average or down approximately 13%.
SUMMARY: After incorporating the aforementioned yields on each state’s respective June harvested acreage base, total production comes out to 4,169 million bushels on 27.0 million harvested acres, which equates to an average yield of 153.3 bpa. I think it’s worth noting that if Illinois’s final corn yield is closer to 170 bpa, as some have speculated in recent market wires, that would add another 70 million bushels to IL’s total state corn production.
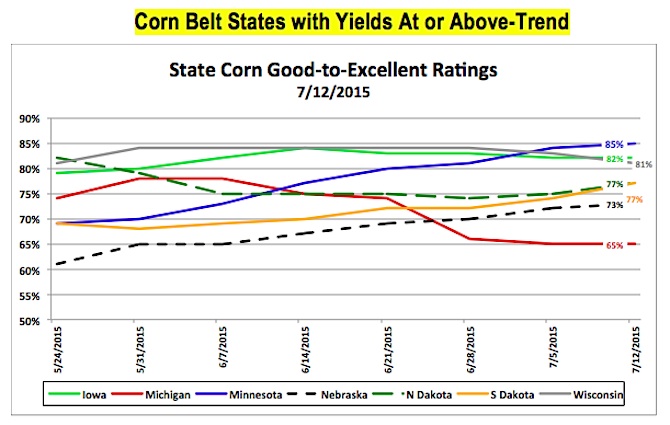
CORN BELT STATES WITH YIELDS LIKELY AT OR ABOVE-TREND: IOWA, NEBRASKA, MINNESOTA, SOUTH DAKOTA, WISCONSIN, NORTH DAKOTA, MICHIGAN
- There are currently 7 states that I believe most in the market would agree are likely to see their final state corn yields come in at or above-trend line in 2015, those being Iowa, Nebraska, Minnesota, South Dakota, Wisconsin, North Dakota, and Michigan. Of those 7 states, Iowa currently has the highest good-to-excellent rating at 85% with Minnesota close behind at 82%. What’s the significance of those two particular states having the highest corn ratings of the top 12 corn producing states? Iowa happens to be the largest corn producer in the country with Minnesota coming in at a very respectable number 4. Right now Iowa and Minnesota’s good-to-excellent ratings would seem to suggest that both are in a position to score record corn yields in 2015 exceeding their previous records of 182 bpa in Iowa (2009) and 177 bpa in Minnesota (2010). Collectively those 2 states produced more corn on average from 2013 and 2014 than Indiana, Ohio, Kansas, Missouri, and Wisconsin combined. The point being record yields in Iowa and Minnesota clearly have the ability to offset bushels lost in other sections of the Corn Belt. I think it’s also worth noting that in 2014, when nationally the US smashed the previous record corn yield by 6.3 bpa due primarily to record state corn yields in Illinois, Indiana, and Ohio, both Iowa and Minnesota experienced much less favorable results. Iowa’s corn yield in 2014 was 179 bpa with Minnesota coming in at just 156 bpa. However both were essentially afterthoughts among most in the marketplace given just how good the crop was last year in the ECB. Therefore the reality is that even in 2014 corn conditions were far from perfect in every top 12 corn producing state and yet the US as a whole was still able to achieve a record corn yield of 171 bpa.
- Based on each state’s most recent good-to-excellent rating, along with its 2 and 5-year yield history, I estimated each state’s current corn yield at the following: Iowa 188 bpa, Nebraska 179 bpa, Minnesota 180 bpa, South Dakota 148 bpa, Wisconsin at 156 bpa, North Dakota at 124 bpa and Michigan at 158 bpa. Iowa’s yield if achieved would represent a record by 6 bpa. Minnesota’s yield would also represent a record by 3 bpa. And finally Nebraska’s yield would match its record yield from a year ago. Nebraska it should be noted is the 3rd largest corn producing state in the country.
SUMMARY: After incorporating the aforementioned yields on each state’s respective June harvested acreage base, total production comes out to 7,328 million bushels on 42.48 million harvested acres, which equates to an average yield of 172.5 bpa.
The other missing component is a production forecast on the “others”, which is comprised of those states not in the top 12 of total state corn producers. For 2015 I’m currently estimating total corn production in the “others” category at 1,781 million bushels, which incorporates the USDA’s June harvested acreage forecast for this group of 11.421 million acres and an average yield of 155.9 bpa. The yield I applied was the average from 2013 and 2014.
CONCLUSIONS:
After adding up the state corn production totals from each sub-category along with the “others,” total US corn production pencils back at 13,278 million bushels (-252 million versus July), which on the USDA’s June harvested acreage base of 81.101 million acres equates to a final US corn yield of 163.7 bpa.
As I mentioned previously, if Illinois’s final corn yield is actually closer to 170 bpa, which would still be 30 bpa below a year ago, the US corn yield would jump nearly 1 bpa to 164.6 bpa. Obviously there’s still plenty of weather to go through before any real determinations can be made on this year’s corn crop; however that was not entirely the purpose of this study. The intention was to take a real look at plausible yield scenarios by state (which we don’t have from the USDA as of the July Crop report), inclusive of what we know today via crop condition ratings, apply the USDA’s June harvested acreage estimates, and then decide on the real impact on total US corn production. Only then can a trader truly justify taking a new position with December corn futures currently trading at approximately $4.40 per bushel as of Thursday’s closes (which is up nearly 80-cents per bushel from CZ’s day low on 6/16).
Additional Charts For Reference:
Thanks for reading and have a great week.
Data References:
- USDA United States Department of Ag
- EIA Energy Information Association
- NASS National Agricultural Statistics Service
Any opinions expressed herein are solely those of the author, and do not in any way represent the views or opinions of any other person or entity.


