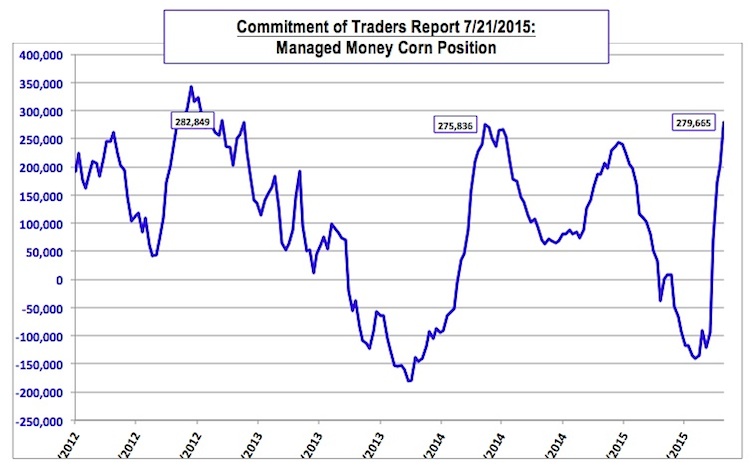
 The corn market really never had a chance this week (Thursday’s 5 ¼-cent higher close notwithstanding). The downward spiraling price action was initially set in motion by last Friday’s Commitment of Traders report, which was released after the market closed on 7/24. In my opinion this report was the key contributing factor to the gap lower opening and close in December corn futures on Monday afternoon, which resulted in CZ5 closing down 19 ¼ at $3.83 ½. Just what did that report reveal that likely caught the remaining Corn Bulls by surprise? It showed the Managed Money net long increasing week-on-week (as of 7/21) by an incredible 76,918 contracts to 279,665 contracts total, which represented the largest Managed Money net long in corn since October 23, 2012 (282,849 contracts).
COT Report Managed Money Chart 2012-2015
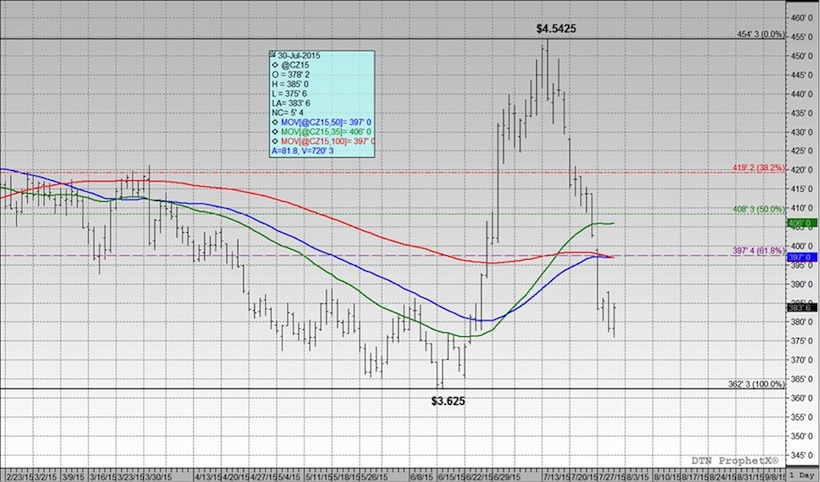
However, more importantly, over that same time period the corn market had already begun trending lower versus its recent highs (down 21 ¼-cents per bushel from 7/14 thru 7/21). Therefore despite the very active and continued buying presence on the part of money managers December corn was in fact selling-off, which in retrospect was a pretty clear indication of a market that was still overbought and ripe for a continued correction. That said both the 50 and 100-day moving averages proved essentially useless in providing support during Monday’s sharply lower opening.
2015 December Corn Prices Chart
Monday’s Crop Progress report also added to the negative tone showing not only a continuation of stabilizing crop conditions in soybeans (62% good-to-excellent, unchanged versus a week ago) but even in a slight improvement in corn. The US corn crop’s good-to-excellent rating increased 1% week-on-week to 70% versus 75% a year ago. Iowa and Minnesota’s corn ratings of 83% and 87% respectively certainly kept pace with market expectations that have both in a position to harvest potentially record setting corn crops this fall. And even Illinois saw its good-to-excellent rating in corn up 1% for the week; improving to 57%. Corn silking improved to 78% nationally versus the 5-year average of 77%. Furthermore with no immediate heat threat in play in the 8 to 14-day forecast for the Midwest (NOAA’s actually forecasting normal to below-normal temperatures), the market appears ready to extract any remaining weather premium associated with potential pollination concerns back out of corn prices. This too is providing additional overhead resistance.
Is December corn now in a position to challenge its current contract low of $3.62 ½, which was established on June 15th and 16th of 2015? A few key considerations are as follows:
Traditionally it’s been my approach to try and find a potential analog crop year versus the present, which can offer some potential insight on corn’s price behavior over time given a similar fundamental backdrop. Right now due to the strength in crop condition ratings specifically in the WCB, the trade appears to be comfortable penciling in a final US corn yield above 162 bushels per acre, which would put 2015/16 in fairly select company. In fact this has only been achieved 2 times in history; including 2009/10’s final US corn yield of 164.7 bpa, as well as, last year’s current standing record US corn yield of 171 bpa. After examining the post-July price action in December corn futures in each of those two crop years I was able to identify the following trends.
- New December corn futures lows were established in both years AFTER the month of July.
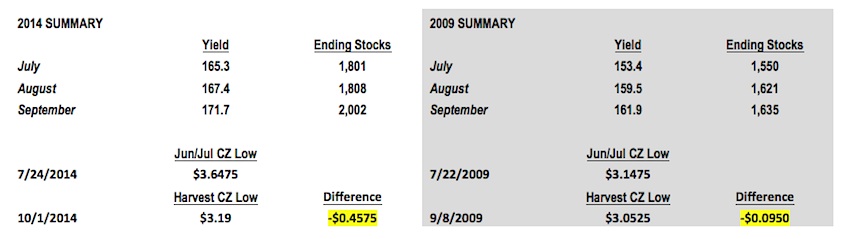
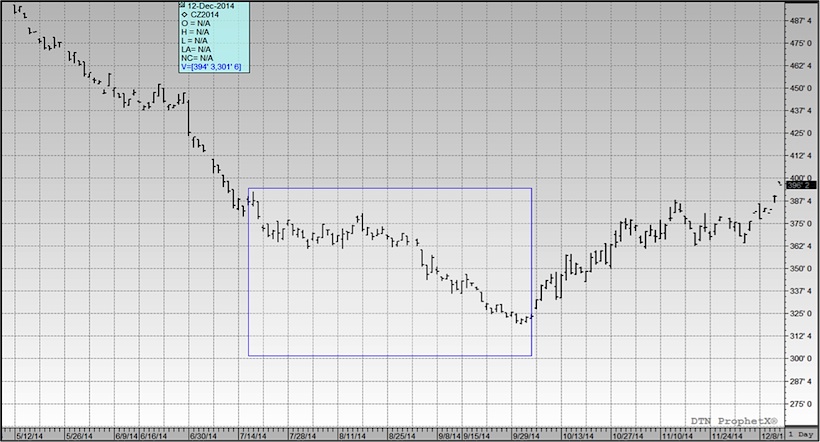
- In July of 2014, December corn futures made a day low and monthly low on July 24th of $3.64 ¾. On October 1st, 2014, December corn futures traded down to a day low and new contract low of $3.19. (Total move from July low to new contract low = -45 ¾ cents per bushel)
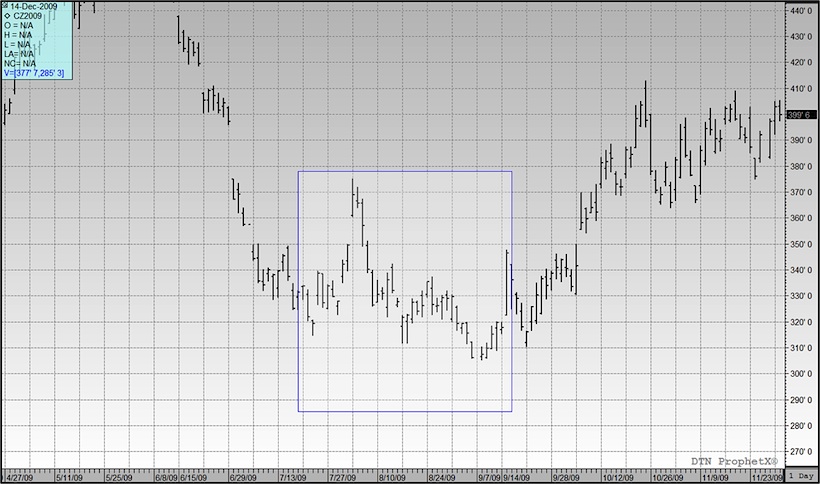
- In July of 2009, December corn futures made a day low and monthly low on July 22nd of $3.14 ¾. On September 8th, 2009, December corn traded down to a day low and new contract low of $3.05 ¼. (Total move from July low to new contract low = -9 ½ cents per bushel)
- Therefore the average December futures price disparity between the July lows and the eventual “harvest” lows or contract lows in those 2 crop years was -27.6 cents per bushel.
- HOWEVER, in each of those 2 crop years both the August and September monthly WASDE reports featured consecutive US corn yield increases and US corn ending stocks increases from July to August and then August to September
- In September of 2014, the US corn yield was estimated at 171.7 bpa versus 167.4 bpa in August and 165.3 bpa in July; In September of 2014, the US corn carryout was estimated at 2,002 million bushels versus 1,808 million in August and 1,801 million in July
- In September of 2009, the US corn yield was estimated at 161.9 bpa versus 159.5 bpa in August and 153.4 bpa in July; In September of 2009, the US corn carryout was estimated at 1,635 million bushels versus 1,621 million in August and 1,550 million in July
- Therefore the average yield increase from July to September was 7.5 bpa and the average corn ending stocks increase was 143 million bushels for 2009 and 2014
Considering the above, just how similar is 2015 then to 2014 and 2009? I think the key similarity is the current December futures low that was scored in June of this year of $3.62 ½ versus the low achieved in July of 2014 at $3.64 ¾. I do believe this is a critical observation from the standpoint of assessing just how low December futures could go over the short-term. Now obviously we know that in both 2014 and 2009, December corn futures eventually traded down under $3.20 per bushel; however I would argue the continuation of those particular sell-offs was predicated more so on the August and September WASDE reports both affirming higher and higher US corn yields and US corn ending stocks. This in turn could be the major difference in 2015, which could limit December corn’s downside under the current June low into the August through October timeframe. Right now the prevailing market opinion is that both the US corn yield and US corn carryout will be lowered in August and potentially September. Does this mean I’m suggesting the current CZ low of $3.62 ½ is safe this fall? Not necessarily, however we could see a pattern very similar to 2009’s where the difference between the “summer” low and “harvest” low was only approximately 9-cents per bushel, which would suggest something in the low $3.50’s for 2015 as a possibility. Point being I wouldn’t get overly bearish December corn futures under $3.70 a bushel. The trend in yield and carryout relative to the current CZ5 low of $3.62 ½ should provide underlying support even as this market transitions beyond the key pollination window.
2014 December Corn Futures Chart
2009 December Corn Futures Chart
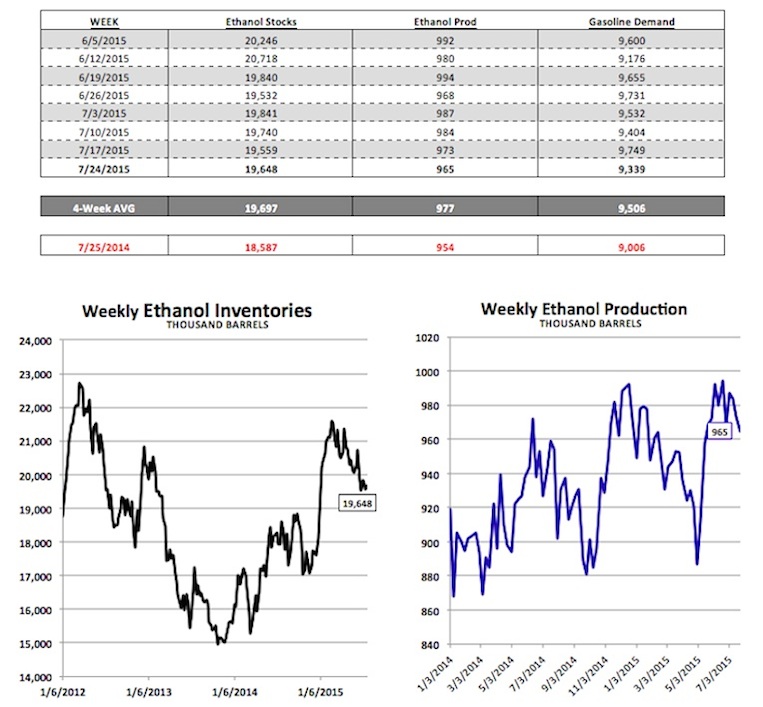
Weekly EIA Ethanol Summary:
Wednesday’s EIA report showed weekly ethanol production dropping to 965,000 bpd versus 973,000 bpd a week ago and the 4-week average of 977,250 bpd. This week’s production figure was the lowest run-rate registered since the week ending May 15th, 2015. Ethanol inventories increased 89,000 barrels to 19.648 million. Despite the nominal increase, ethanol stocks have now been reported at less than 20 million barrels for 6 consecutive weeks. Gasoline demand was down 4.2% week-on-week; however at 9.339 MMbpd, this was still well above last year’s figure of 9.006 MMbpd. Furthermore, this year weekly gasoline demand has averaged 9.523 MMbpd during June and July compared to just 8.957 MMbpd in 2014 and 8.979 MMbpd in 2013.
Thanks for reading and have a great week.
Twitter: @MarcusLudtke
Data References:
- USDA United States Department of Ag
- EIA Energy Information Association
- NASS National Agricultural Statistics Service
Any opinions expressed herein are solely those of the author, and do not in any way represent the views or opinions of any other person or entity.

: Showing Some Signs of Emerging Strength")
