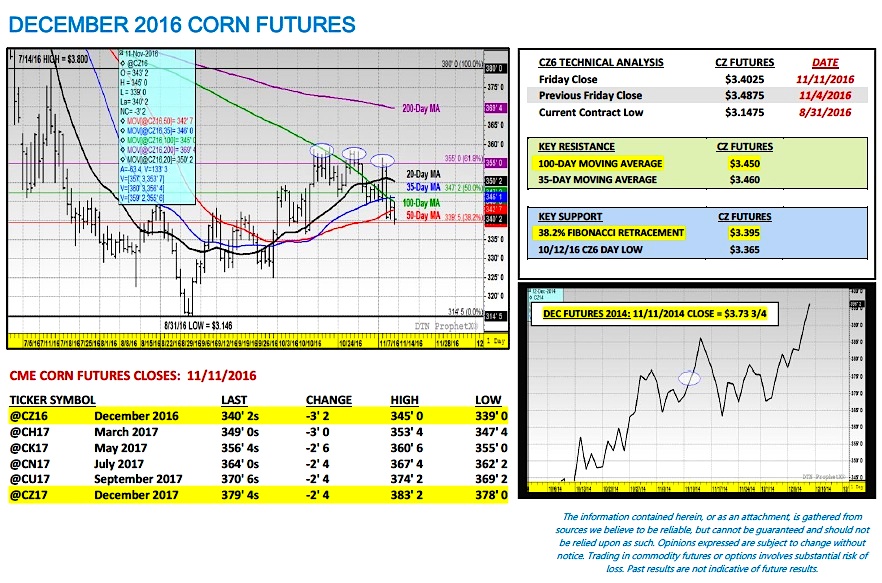
On Wednesday (11/9), the reaction to the news release of the USDA’s November 2016 WASDE report was both swift and aggressive, culminating in December corn futures closing down 13 ½-cents per bushel that afternoon at $3.40 ¾ (its lowest close in CZ6 since October 12th).
What were the primary negative focal points of the USDA’s updated U.S. and World Corn supply and demand estimates? Here’s two:
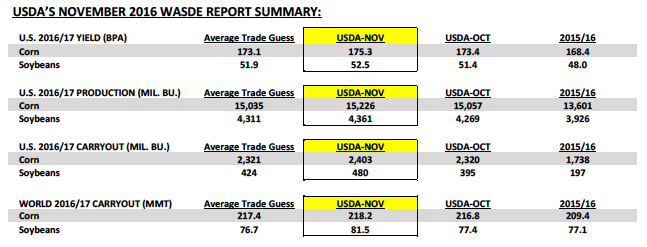
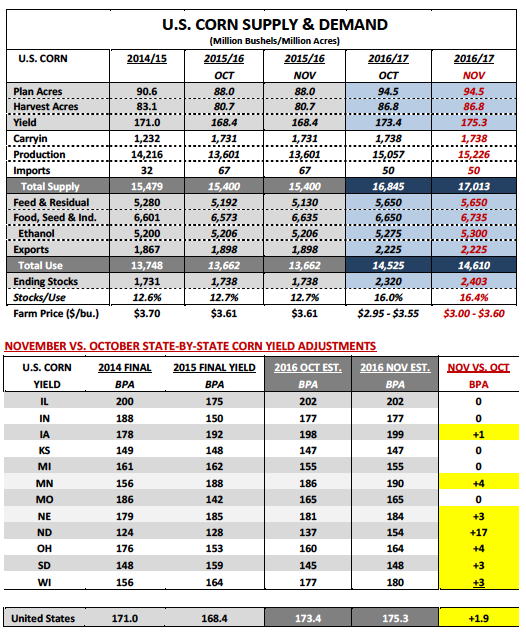
1). The USDA increased the 2016/17 U.S. corn yield to a new record high of 175.3 bpa versus 173.4 bpa in October and the average trade guess of 173.1 bpa. The net impact on total U.S. corn production was a monthly increase of 169 million bushels to 15,226 million. By comparison the market was anticipating a slight production decrease of 22 million bushels versus the USDA’s October forecast of 15,057 million bushels. 2016/17 U.S. corn ending stocks ballooned to 2,403 million bushels versus 2,320 million in October. The current ending stocks projection now exceeds the 2015/16 U.S. corn carryout by 665 million bushels or 38.3%.
2). The USDA increased 2016/17 World Corn ending stocks to a new record high of 218.2 MMT, which exceeded the average trade guess of 217.4 MMT and was 8.8 MMT higher than a year ago. The USDA left Brazil’s 2016/17 corn production estimate unchanged from a month ago at 83.5 MMT; however this still represented a 16.5 MMT improvement versus Brazil’s drought reduced crop from 2015/16. Other key corn producing countries expected to show material production increases versus a year ago include: South Africa (up 5.1 MMT), Argentina (up 7.5 MMT), and Ukraine (up 3.7 MMT). Of the countries just mentioned Brazil, Argentina, and Ukraine are the world’s 2nd, 3rd, and 4th largest corn exporters, trailing only the United States.
What states are expected to achieve Record Corn Yields in 2016?
Of the top 4 U.S. corn producing states in the country, Iowa, Illinois, and Minnesota are now all expected to establish new record high state corn yields for 2016. Iowa’s corn yield was raised to 199 bpa in November, up 1 bpa from a month ago, and 7 bpa above its previous record. Illinois’s corn yield was left unchanged at 202 bpa; however that estimate still exceeds its prior record by 2 bpa from 2014. And Minnesota saw its state corn yield increased to 190 bpa, up 4 bpa from October, and 2 bpa above of its previous record. Nebraska remains the only member of that group not expected to harvest a record corn yield in 2016; however it should be noted the USDA’s latest forecast for NE of 184 bpa is now just 1 bpa below its previous record yield as well. Collectively those 4 states are projected to produce 8,277.5 million bushels of corn in 2016 on 42.5 million harvested acres versus 7,639.7 million bushels on 41.3 million acres harvested in 2015/16.
That said there are two other states that have experienced record growing seasons in 2016. Wisconsin remains on pace to establish a new record high corn yield of 180 bpa. And North Dakota, with its current state corn yield forecasted at 154 bpa, is on pace to destroy its previous record high by an incredible 22 bpa. State corn production in North Dakota is projected to be up 173 million bushels versus a year ago or +53%. This is due in large part to its record yield but also a year-on-year increase in harvested corn acreage of 690,000 acres.
Key December Futures (CZ6) Pricing Considerations For The Week Ending 11/11/2016:
December corn futures closed on Friday (11/11) at $3.40 ¼, finishing down 8 ½-cents per bushel week-on-week. On Thursday and Friday, CZ6 closed back under several key support levels including the 35, 50, and 100-day moving averages. The chart action (see page 6) in December corn futures shows prices consolidating between $3.39 through $3.55. The question now is will the next move be higher, lower, or more of the same (sideways, narrow trading range)?
The long-term challenges to sustainable rallies in corn (above $3.55 CZ6) were once again reinforced in the November WASDE report and arguably even strengthened for the following reasons:
- The USDA increased the U.S. corn yield in the November 2016 WASDE report after two successive monthly decreases in the September and October WASDE reports. The USDA will not adjust the U.S. corn yield now until it finalizes its projection in the January report. That means traders will have essentially the next two months to justifiably ponder another yield increase looming in that report. This possibility will be front and center (providing resistance) every time corn futures attempt to break out of the current trading range to the upside.
- 2016/17 total U.S. corn demand was estimated at 14,610 million bushels in the November WASDE report, which if realized would be a record high by 862 million bushels or +6.3% (previous record high was 2014/15’s 13,748 million bushels). This included U.S. corn exports forecasted at 2,225 million bushels (highest since 2007/08) with domestic usage (primarily feed and ethanol) projected at a record high of 12,385 million bushels (+504 million versus previous record). Therefore the problem for Corn Bulls is that the USDA has already likely maximized its usage forecast for 2016/17, which means there’s no offset to preventing continued increases to the U.S. corn carryout if the USDA raises the corn yield again in the January WASDE report. Keep in mind, the current U.S. stocks forecast of 2,403 million bushels is already the highest it’s been since 1987/88.
The 10-year seasonal supports a lower price bias through the end of the month. I see no reason for CZ6 to buck the trend based on current market fundamentals and money-flows. Extended corn rallies will likely be deferred until Q1 2017.
Thanks for reading.
Twitter: @MarcusLudtke
Author hedges corn futures and may have a position at the time of publication. Any opinions expressed herein are solely those of the author, and do not in any way represent the views or opinions of any other person or entity.
Data References:
- USDA United States Department of Ag
- EIA Energy Information Association
- NASS National Agricultural Statistics Service


