MARCH corn futures closed up 4-cents per bushel week-on-week Friday, finishing at $3.56 ½.
Corn is trading around 10-cents off contract lows, but there are a few “minor” reasons for optimism (see further below in the trading outlook section).
First, let’s review the data and what it means.
Weekly Highlights and Takeaways for January 29, 2018
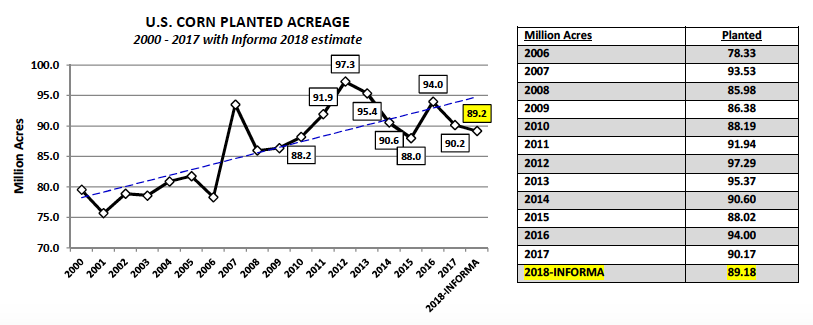
1. This week Informa Economics issued a revised 2018 U.S. corn planted acreage estimate of 89.179 million acres. This was 496,000 acres below Informa’s previous forecast in December and represented a 988,000 planted acreage reduction versus 2017.
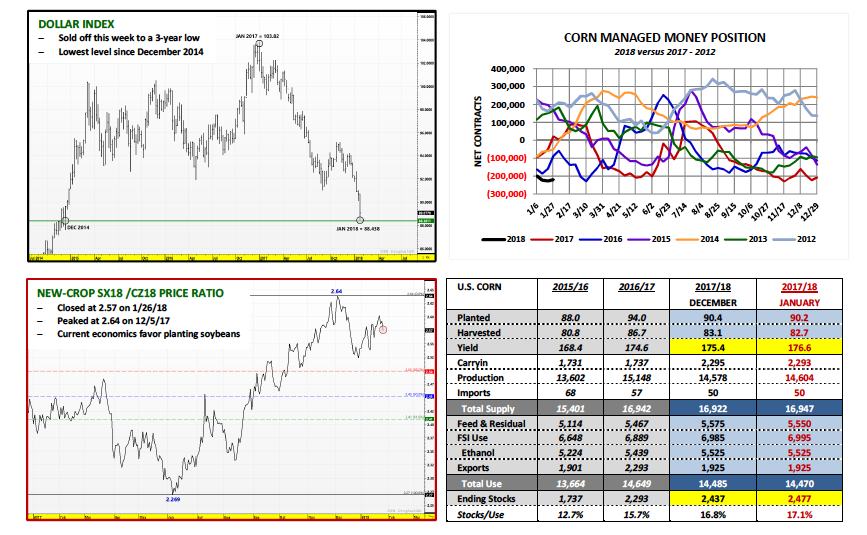
In my commentary last week I alluded to the possibility of a 2018 U.S. corn planted acreage estimate of 89.0 million acres due to the new-crop soybean (SX18) / corn (CZ18) price ratio currently trading at approximately 2.60 (see page 3), which on paper favors planting soybeans. I’m now starting to see more and more private analysts drawing a similar conclusion based on the economic advantage soybeans hold over corn. For Corn Bulls…a lower acreage base of substance in 2018 relative to a year ago remains a top priority (i.e. down 1.0 million or more corn acres).
2. Weekly U.S. corn export inspections totaled 26.3 million bushels for the week ending January 18th, 2018. Crop year-to-date U.S. corn export inspections improved to 499.5 million bushels versus 780.5 million a year ago (-36%). In January the USDA left its 2017/18 U.S. corn export forecast unchanged at 1.925 billion bushels. I still believe that figure could come down as much as 25 to 50 million bushels in proceeding WASDE reports.
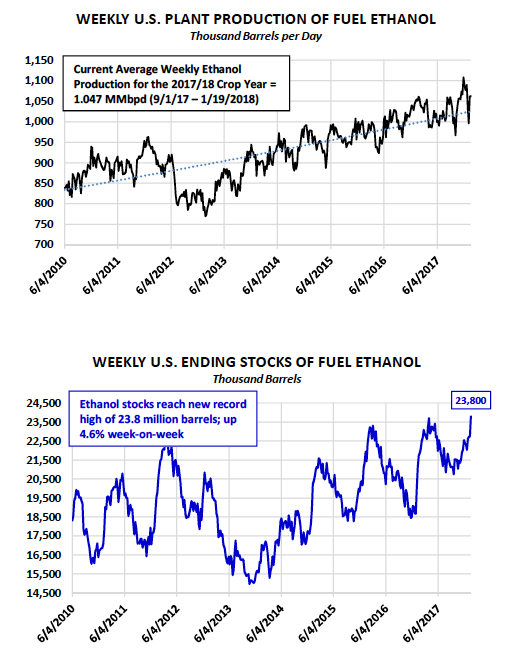
3. U.S. ethanol stocks reached a new record high of 23.8 million barrels for the week ending 1/19/2018 (see chart on page 2). Stocks rose 4.6% week-on-week and are now 9.5% higher versus the same week a year ago. On the supply side…weekly ethanol production averaged 1.062 MMbpd, which was essentially unchanged versus the prior week. 2017/18 crop year-to-date weekly ethanol production has now averaged 1.047 MMbpd (this for the period from 9/1/17 – 1/19/18). This production average if maintained for the entire 2017/18 crop year (ending 8/31/18) would equate to annualized U.S. ethanol production of 16.09 billion gallons.
If I apply an average industry ethanol yield of 2.85 gallons per 1 bushel of corn, and account for a small percentage of ethanol production from sorghum versus corn as the primary feedstock, I come up with a U.S. corn demand for ethanol figure very close to the USDA’s latest estimate of 5.525 billion bushels. Therefore I see no reason for the USDA to increase its U.S. corn demand for ethanol forecast in either the February or March WASDE reports at this time.
4. Friday’s Commitment of Traders report showed the Managed Money net corn short decreasing 7,200 contracts week-on-week to -219,676 contracts as of the market close on 1/23/18. That still means Money Managers are carrying a short corn position within 11,000 contracts of their record short position of -230,556 contracts from 11/17/17. At some point I do believe “the money” will shift to a more neutral stance. This buying in turn could create the opportunity for a push to $3.66 to $3.67 in March corn futures (or $4.00 in December corn futures).
MARCH 2018 CORN FUTURES PRICE FORECAST:
March corn futures traded up to a day high of $3.58 on Thursday, challenging the 100-day moving average of $3.576. However ultimately March corn failed to close above that key resistance level, closing back down at $3.56 ½ on Friday afternoon. That said March corn futures remain more than 10-cents removed from the current contract low of $3.45 ½ established on 1/12/18.
Small reasons for optimism for Corn Bulls include the following:
- Informa’s 2018 U.S. corn planted acreage estimate of 89.179 was likely smaller than the trade was anticipating. This should put a floor in March corn futures at or near $3.50 for the time being.
- Money Managers remain heavily short corn at a time when historically the money starts to reduce its short position exposures. For example last year Money Managers were carrying a small net LONG in corn of approximately +21k contracts as of 1/24/2017. Compare that to their current position of -219,676 contracts. And remember the market was staring at a similar U.S. corn ending stocks projection a year ago. That said…I expect them to neutralize/liquidate their short position to a degree going into the second half of February.
- The Dollar Index has been on a major downward slide of late, reaching a new 3-year low on Friday. Dollar weakness should support commodity values in general.
Therefore I’m not necessarily Bullish corn however I do believe 10 to 15-cents rallies remain possible from current price levels.
Twitter: @MarcusLudtke
Author hedges corn futures and may have a position at the time of publication. Any opinions expressed herein are solely those of the author, and do not in any way represent the views or opinions of any other person or entity.
Data References:
- USDA United States Department of Ag
- EIA Energy Information Association
- NASS National Agricultural Statistics Service


