May corn futures closed down 7 3/4-cents per bushel week-on-week, finishing at $3.82 3/4.
Let’s review the latest corn news, usda data, and analysis for the week ahead (March 19).
Weekly Highlights and Takeaways:
1. Weekly export sales in corn totaled 98.6 million bushels for the 2017/18 marketing year, which was a 23-year high. Total U.S corn sales for 2017/18 improved to 1.718 billion bushels versus 1.786 billion a year ago. Therefore the sales gap relative to 2016/17 has narrowed to just -3.8%. Back in December that differential exceeded -25%. However it should also be noted that while weekly export sales data remains strong, current 2017/18 U.S. corn export inspections (shipments) still trail last year’s pace by -27%.
What does this imply? I believe it has a direct correlation to the remaining unknowns concerning the size of both Brazil’s and Argentina’s 2017/18 corn crops. Brazil and Argentina are the world’s 2nd and 3rd largest corn exporters. In the USDA’s March 2018 WASDE report, 2017/18 Brazil corn production was reduced 0.5 MMT month-on-month to 94.5 MMT versus 98.5 MMT a year ago. 2017/18 Argentina corn production was lowered 3.0 MMT to 36.0 MMT versus 41.0 MMT in 2016/17.
Brazil has likely become the bigger wild card moving forward. The size of Brazil’s 2017/18 corn crop will largely depend on its safrinha corn production. Safrinha corn production accounts for approximately 65 to 70% of Brazil’s total corn crop. Furthermore Brazil’s safrinha corn crop will not be harvested until June, July, and August. At present there are several analysts anticipating approximately a 6% decrease in safrinha planted corn acreage for 2017/18 (Conab estimating a 5.9% acreage decline). Those same analysts have substantially lower total corn production forecasts for Brazil ranging from 86.0 to 87.2 MMT versus the USDA’s March estimate of 94.5 MMT.
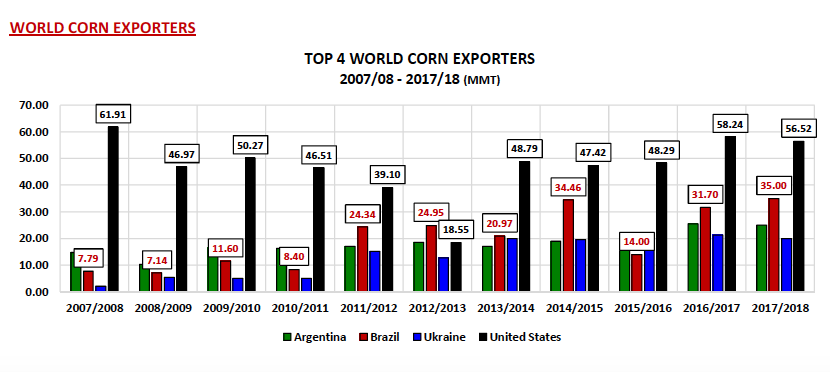
2. EXPORTS CONTINUED – That said I firmly believe some of the world’s largest corn importers (Mexico, Japan, South Korea, and Egypt) are forward booking U.S. corn over fears of Brazil’s 2017/18 corn crop falling 7 to 9 MMT (276 to 354 million bushels) in proceeding WASDE reports (effectively lowering Brazil’s net available corn exports). This then would seem to justify the USDA increasing 2017/18 U.S. corn exports 175 million bushels in its March WASDE report to 2.225 billion bushels. HOWEVER, and here comes the disclaimer, there is no guarantee current U.S. corn sales will ship. Meaning export sales can and often are canceled. Therefore if Brazil’s corn crop eventually proves to be larger than 90 MMT, I believe it’s entirely possible the USDA will lower its current 2017/18 export forecast sometime this summer.
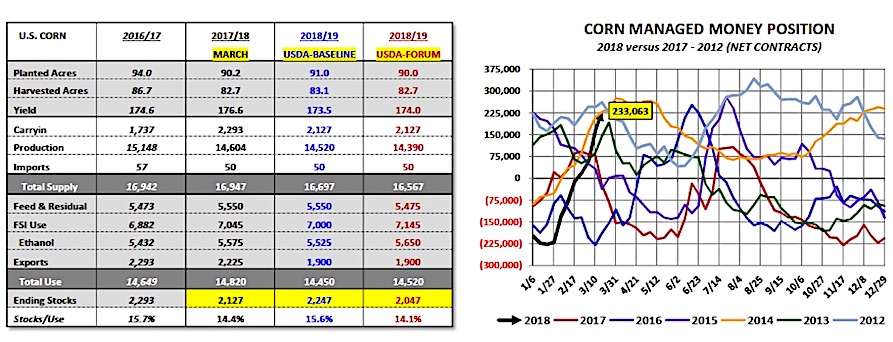
3. Friday’s Commitment of Traders report showed the Managed Money’s net long position in corn exploding higher. As of the market closes on 3/13/18 that position had increased to +233,063 contracts, up +69,528 contracts week-on-week. Since 2012 the Managed Money long position in corn has only been higher as of the second week in March on one other occasion (3/13/2012 at +245,327 contracts). That said should the current Managed Money position in corn be considered Bullish or Bearish? I remain of the opinion the USDA’s current 2017/18 U.S. Corn Ending Stocks estimate of 2.127 billion doesn’t justify this type of market length or May corn futures over $3.90 per bushel. Furthermore…based on the 2018/19 U.S. Corn S&D table the USDA released in February at its Ag Outlook Forum, the 2018/19 U.S. Corn Ending Stocks forecast would still pencil back at over 2.0 billion bushels for the 3rd consecutive crop year. U.S. corn stocks maintaining such elevated levels in succession hasn’t happened since the 1980’s. At some point this should cause Money Managers to pause before adding additional longs with their position already in excess of +230k contracts.
MAY 2018 CORN FUTURES PRICE FORECAST:
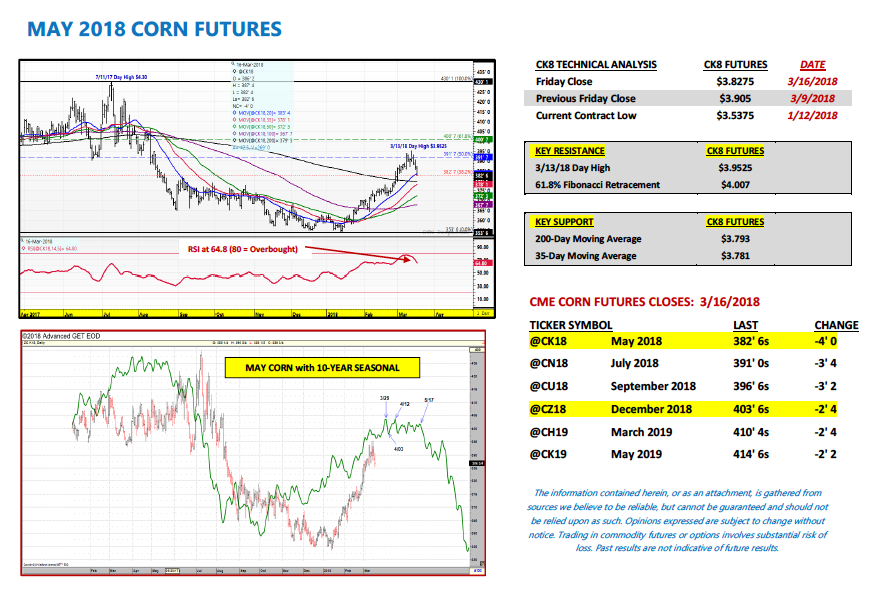
May corn futures closed down 7 ¾-cents per bushel week-on-week, finishing at $3.82 ¾ on Friday afternoon.
Next week will be very important for Corn Bulls. Technically anytime you see the Managed Money long in corn increase substantially only to then have a LOWER weekly close, this isn’t a positive sign for corn prices. It’s often a signal that upward price momentum has stalled. Topside price resistance in May corn futures now begins at Wednesday’s (3/13) day high of $3.95 ¼.
Furthermore…I do expect the market’s attention to shift to the upcoming March 29th Prospective Plantings report early next week. Private acreage estimates for corn are starting to be released by a variety of notable analysts. Thus far I’ve seen 2018 U.S. corn planted acreage figures ranging from 88 to 90 million acres. Once again at the USDA’s Ag Outlook Forum in February, 2018 U.S. corn planted acreage was estimated at 90.0 million acres.
And finally, on page 4, I included the 10-year price seasonal in May corn futures. It offers primarily a sideways-to-lower pricing pattern for May corn AFTER March 29th. Nearby price support to start the week begins at the 200-day moving average of $3.793.
Twitter: @MarcusLudtke
Author hedges corn futures and may have a position at the time of publication. Any opinions expressed herein are solely those of the author, and do not in any way represent the views or opinions of any other person or entity.
Data References:
- USDA United States Department of Ag
- EIA Energy Information Association
- NASS National Agricultural Statistics Service


