MAY corn futures closed up 5 ¼-cents per bushel week-on-week, finishing at $3.90 ½.
The March 2018 WASDE report offered some continued ammunition for Corn Bulls. Let’s review the bullish case… and what might be holding it up.
Bullish Takeaways for Corn TRADERS
- 2017/18 U.S. corn ending stocks were lowered to 2.127 billion bushels. This represented a 225 million bushel decrease versus February and was also 186 million bushels BELOW the average trade guess. Lower ending stocks were attributed to the USDA increasing its 2017/18 U.S. corn export projection 175 million bushels month-on-month to 2.225 billion bushels, as well as, a 50 million bushel increase to corn-ethanol demand, which improved to 5.575 billion bushels.
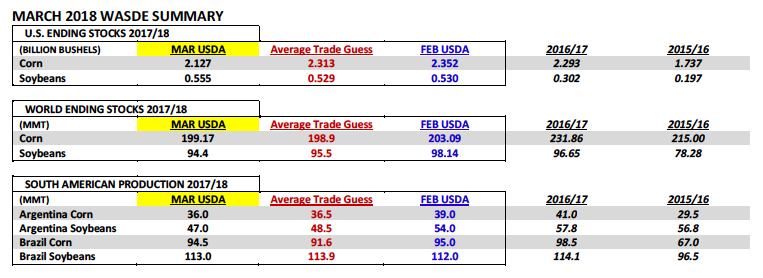
- 2017/18 Argentina corn production was lowered to 36 MMT, down 3 MMT from February and 5 MMT below 2016/17. Argentina’s corn export estimate fell to 25 MMT, down 2 MMT from February. Also of note Brazil’s 2017/18 corn production forecast dropped slightly to 94.5 MMT, down 0.5 MMT from a month ago. However…Brazil’s export projection was left unchanged at 35 MMT versus 31.7 MMT in 2016/17. Brazil and Argentina represent the 2nd and 3rd largest world corn exporters. The decreases to Argentina and Brazil’s corn crops would seem to justify the USDA’s major increase to its U.S. corn export forecast.
- 2017/18 World corn ending stocks fell to 199.2 MMT versus 203.1 MMT in February and 231.9 MMT in 2016/17. The USDA’s revised World corn carryout estimate was actually slightly higher than the average trade guess; however the crop year-on-year decline of 32.7 MMT or 1.29 billion bushels still drew plenty of attention.
REASONS TO PAUSE FOR CORN BULLS…
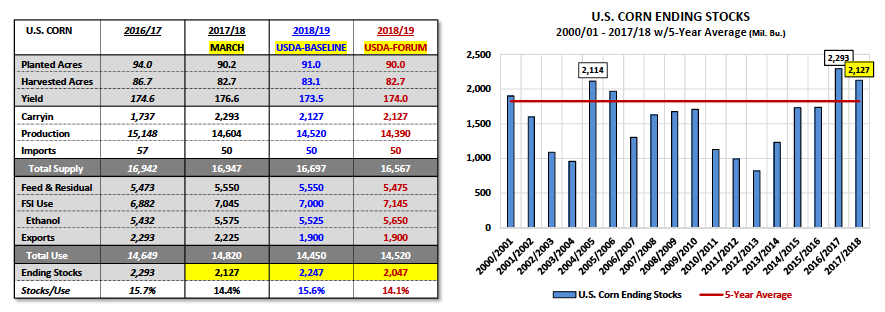
- The USDA’s revised 2017/18 U.S. corn ending stocks estimate of 2.127 billion bushels is still the 2nd highest in 30-years and 303 million bushels ABOVE the 5-year average of 1.824 billion bushels. Therefore with corn futures already trading at their highest level since August 2017 and approximately 40-cents removed from their calendar year day lows on January 12th, 2018 the question remains, “How much more do corn prices need to rally (in March/April) to account for a U.S. corn carryout that is still one of the largest ever in recent history?”
It’s also worth pointing out that Argentina’s corn crop even at 36 MMT would still be its 2nd largest production total ever. Argentina’s revised corn production estimate for 2017/18 remains 3.55 MMT (or 139.8 million bushels) ABOVE its 5-year average. Clearly we aren’t hearing that narrative being added to any discussions regarding Argentina’s production prospects for the current crop year. Instead the trade has chosen to focus on Argentina’s “drought” and its production total solely in relation to last year’s record crop of 41 MMT.
- And finally those who deemed the U.S. corn ending stocks revision “Bullish,” the 25 million bushel increase to 2017/18 U.S. soybean ending stocks was equally, if not more Bearish soybean futures. The USDA raised the 2017/18 U.S. soybean carryout to 555 million bushels, 26 million above the average trade guess and 253 million bushels larger than 2016/17. With corn (CZ18) and soybean (SX18) futures still correlated at this time (considering they are technically competing for acres for 2018) if soybean futures sell-off it should pull corn lower or at the very least make it difficult for corn to rally while that is occurring. The new-crop soybean/corn ratio has already narrowed to 2.53 since the release of Thursday’s report compared to last Friday’s (3/2) close of 2.57, which supports this point of view.
MAY 2018 CORN FUTURES PRICE FORECAST:
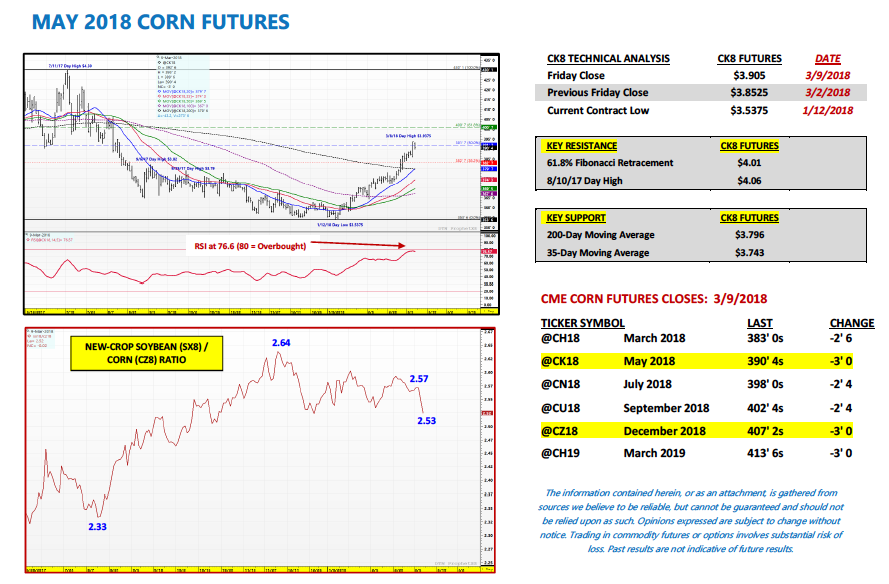
May corn futures traded up to their highest level since August 2017 on Thursday (3/8), making a new 2018 calendar year day high of $3.93 ¾. CK18 did close down 3-cents on Friday afternoon at $3.90 ½; however May corn futures still managed a 5 ¼-cent higher weekly close.
Momentum in corn remains higher. I would argue most of it, if not all of it is technical in nature. 2017/18 U.S. corn ending stocks of 2.127 billion bushels do NOT in my opinion support current price levels. That said Corn Bulls continue to control the narrative. What does this mean? It means that rather than report U.S. corn ending stocks at nearly a 30-year high, they shift the conversation to stocks falling 225 million bushels from February. Or focus on improving U.S. corn export sales while ignoring the fact that even with that increase, which equates to slightly lower 2018/19 U.S. corn carryin stocks, the 2018/19 U.S. corn carryout is still likely to exceed 2.0 billion bushels for the 3rd consecutive year. These are the psychological games being played at this time. Money managers have come to the aid of the bullish rallying cry as well with one noted private analyst estimating the Managed Money net long in corn now at over 145k contracts as of Friday morning.
Next week is YUGE (Trump inspired) for Corn Bulls. May soybeans closed down nearly 25-cents on Friday…so corn might have to rally on its own. That could prove difficult.
Twitter: @MarcusLudtke
Author hedges corn futures and may have a position at the time of publication. Any opinions expressed herein are solely those of the author, and do not in any way represent the views or opinions of any other person or entity.
Data References:
- USDA United States Department of Ag
- EIA Energy Information Association
- NASS National Agricultural Statistics Service


