Let me preface this by saying that there are several good stocks out there… and several that are outperforming the market or peers during the ongoing stock market correction.
Today I want to share two of them: Verizon (NYSE: VZ) and Medtronic (NYSE: MDT).
Both stocks are large cap blue chips. Verizon is in the technology / media-telecom industry and Medtronic is in the Medical Products Industry.
The Telecom Industry has a current Investors Business Daily (IBD) RS ranking of 18th out of 197, while the Medical Products Industry ranks 28th.
Note that the following MarketSmith charts are built with Investors Business Daily’s charting suite. I am an Investors Business Daily (IBD) partner and promote the use of their products. The entire platform offers a good mix of technical and fundamental data.
Let’s take a look at the weekly charts for Verizon (VZ) and Medtronic (MDT).
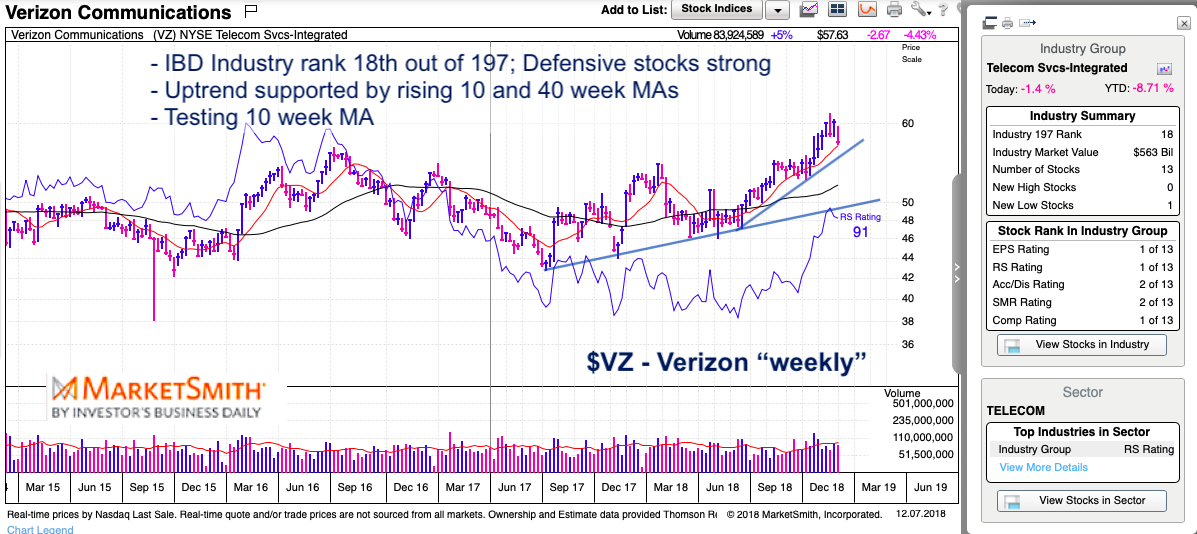
$VZ Verizon Weekly Chart
Below is a weekly chart of Verizon. The chart is annotated and speaks for itself. But the key here to me is that it is outperforming. Verizon made new highs a few weeks ago and is testing its 10 week moving average and above its near-term and intermediate-term trend lines. Also sandwiched between the trend lines is the 40 week moving average.
These are all points of reference for those interested in the blue chip. Active investors would like to see the stock hold the near-term uptrend line. But the 40 week MA would offer good risk-reward (with a stop out) should it get tested. That area would also mark a retest of the breakout.
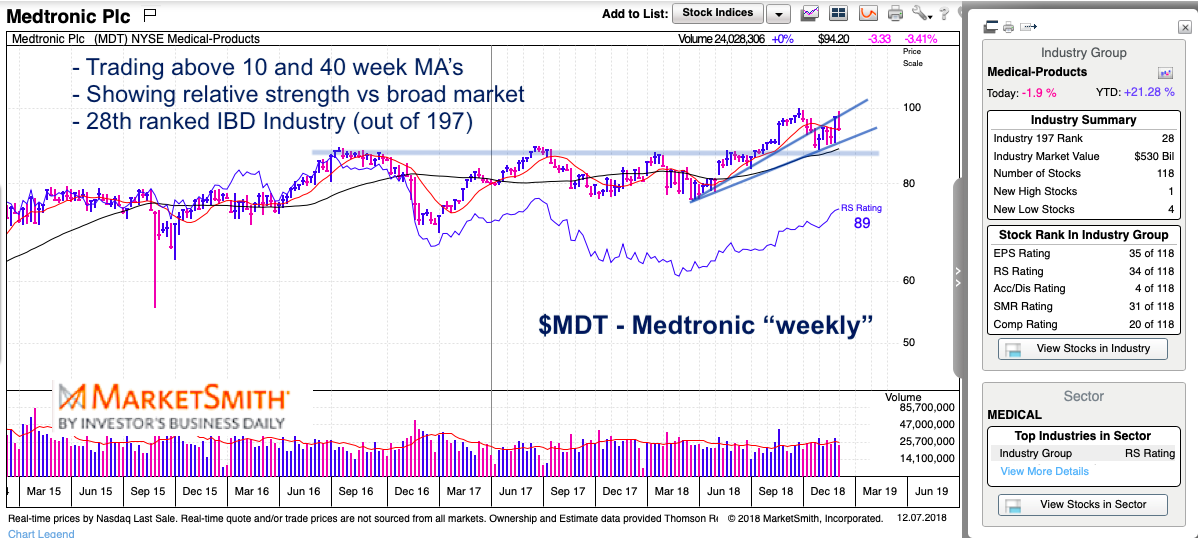
$MDT Medtronic Weekly Chart
Another strong stock during this volatile, corrective period. Medtronic is holding nicely above the 87-90 breakout area. That area was retested during the current correction and could be probed again (note that the 40 week MA is sitting right there too).
The latest rally retested the fall high (and back-tested the underside of the near-term broken trend line). MDT is likely rangebound between 87-100 over the near-term. Watch both edges for breakout or breakdown.
Twitter: @andrewnyquist
The author does not have a position in mentioned securities at the time of publication. Any opinions expressed herein are solely those of the author, and do not in any way represent the views or opinions of any other person or entity.

 Rolling Over At Key Fibonacci Level?")


