It’s been a brutal two year run for treasury bonds. It all started with a spike high on the initial news of COVID (coronavirus), but that was followed by a “letting the air out of the balloon” type move lower.
Add in a strong dose of inflation and you have higher bond yields and MUCH lower bond prices.
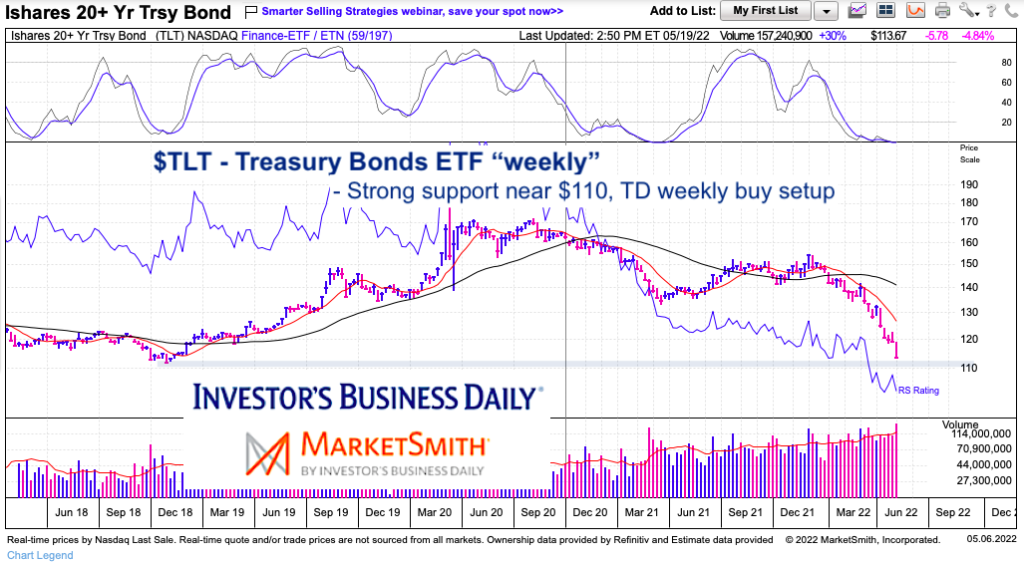
All in all, the decline in long-dated treasury bonds has been ugly. And this shows up on the “weekly” chart of the $TLT (20+ year treasury bond ETF).
BUT there may be some good news… even if short-term. It looks like a bounce is overdue.
Note that the following MarketSmith charts are built with Investors Business Daily’s product suite.
I am an Investors Business Daily (IBD) partner and promote the use of their products. The entire platform offers a good mix of analysts, education, and technical and fundamental data.
$TLT Treasury Bond ETF “weekly” Chart
The long-dated bond ETF is trading near important support around $110. It has also recorded a TD 9 buy setup which may produce a bounce over the coming weeks. I’m looking for a test of the 10-week moving average. Then we’ll see…
Twitter: @andrewnyquist
The author may have a position in mentioned securities at the time of publication. Any opinions expressed herein are solely those of the author, and do not in any way represent the views or opinions of any other person or entity.


 Ready To Break Out?")
 Rolling Over At Key Fibonacci Level?")

")
