With interest rates falling, that means that treasury bond prices are rising. Finally!
The collapse in bond prices was epic… so bond investors were overdue for this bounce. And perhaps it will be a longer-lasting bounce.
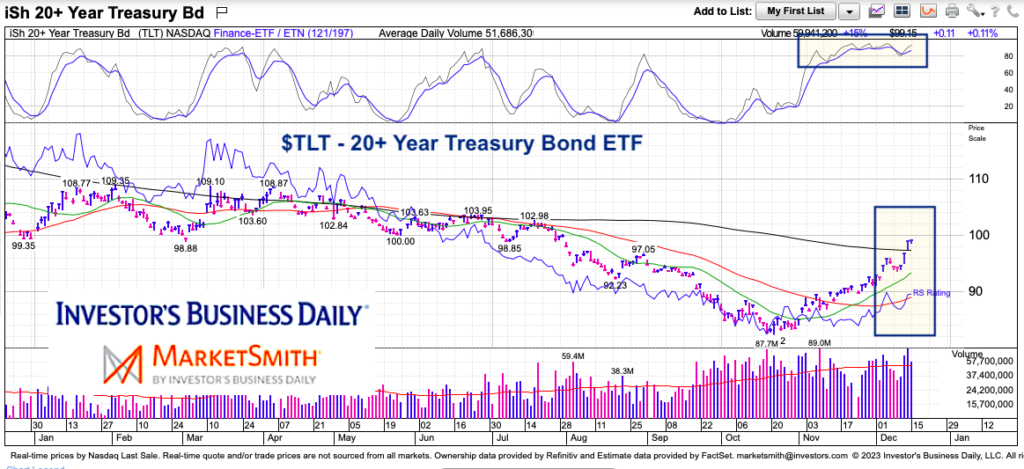
Today’s chart is the $TLT 20+ Year Treasury Bond ETF. We will look at the current rally while analyzing where we might be in terms of timing for the rally.
Note that the following MarketSmith charts are built with Investors Business Daily’s product suite.
I am an Investors Business Daily (IBD) partner and promote the use of their products. The entire platform offers a good mix of tools, education, and technical and fundamental data.
$TLT 20+ Year Treasury Bond ETF Chart
As you can see, the rally have been quite strong. But it was over due — if you zoom out and look at the past few years, you’ll see the collapse.
TLT has rallied 20 percent from its recent low but is short-term overbought (shaded in top quadrant). So a pullback is expected. The good news is that the 20 and 50 day moving average have turned higher and could be supportive to furthering the bounce in bonds into next year.
Twitter: @andrewnyquist
The author may have a position in mentioned securities at the time of publication. Any opinions expressed herein are solely those of the author, and do not in any way represent the views or opinions of any other person or entity.


: Showing Some Signs of Emerging Strength")
