The financial markets have been pretty volatile of late.
Domestic politics have been pretty crazy, while international geopolitics have been difficult to put a finger on.
From the war in Iran to the on-going war in Ukraine, the U.S. has been in a watchful, pro-active mode.
BUT, nothing tells us more than the on-goings of the U.S Treasury market.
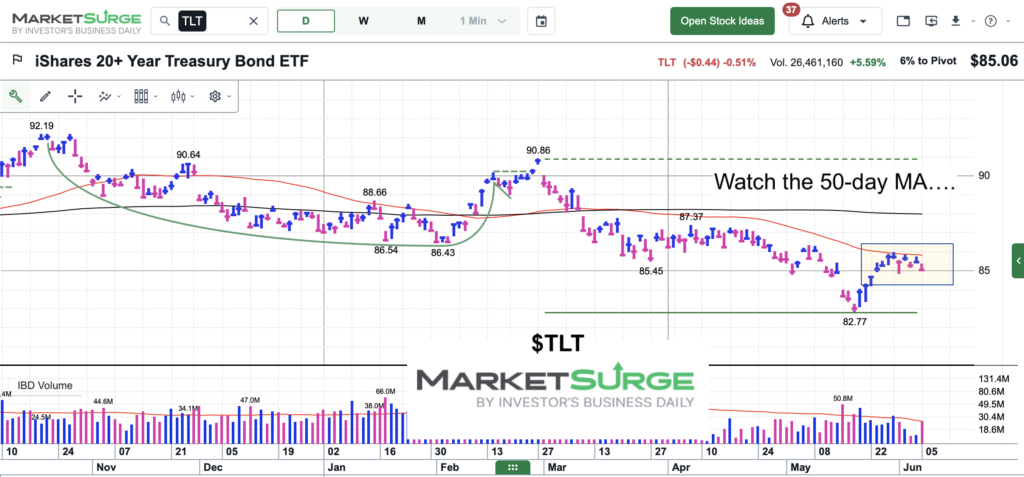
Today, we look at a chart of the popular 20+ Year U.S. Treasury Bond Market ETF… and we highlight an extremely important price level to watch.
Note that the following MarketSurge charts are built with Investors Business Daily’s product suite.
I am an Investors Business Daily (IBD) partner and promote the use of their products. The entire platform offers a good mix of tools, education, and technical and fundamental data.
$TLT Treasury Bonds ETF Chart
As you can see, the 50-day moving average is being tested. This level is very important in determining the next move for this index. If TLT breaks out to the upside, then that will mean interest rates are falling. BUT if TLT struggles here and moves lower, then interest rates are moving higher yet. Stay tuned.
Twitter: @andrewnyquist
The author may have a position in mentioned securities at the time of publication. Any opinions expressed herein are solely those of the author, and do not in any way represent the views or opinions of any other person or entity.


