The popular treasury bonds etf (TLT) has been trading in a very tight space for months. Or better stated, it has been narrowing/tightening for months.
This all comes after a precipitous 2-year decline from 2020 into 2022.
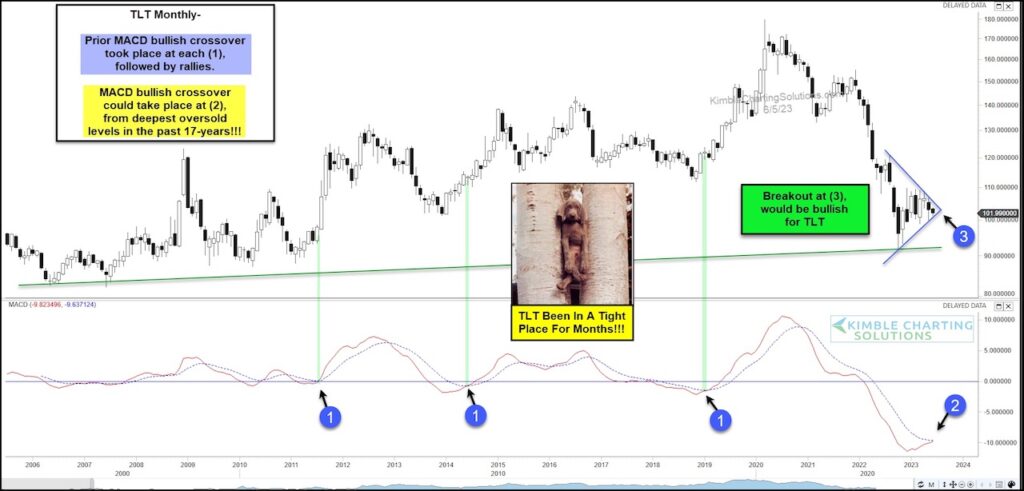
Below you will find today’s long-term “monthly” price chart of the 20+ Year Treasury Bond ETF (TLT).
As you can see, TLT has been in a narrowing pennant pattern for the past 9-months, frustrating both bulls and bears.
The MACD momentum indicator could be creating a bullish crossover at (2), from the most oversold levels in the past 17-years. Similar crossovers are marked at each point (1) and have produced big rallies.
Should TLT breakout at (3), it would send its first bullish message in a LONG time. Stay tuned!
$TLT 20-Year+ Treasury Bond ETF “monthly” Chart
Note that KimbleCharting is offering a 2 week Free trial to See It Market readers. Just send me an email to services@kimblechartingsolutions.com for details to get set up.
Twitter: @KimbleCharting
Any opinions expressed herein are solely those of the author, and do not in any way represent the views or opinions of any other person or entity.

: Showing Some Signs of Emerging Strength")
