As the Federal Reserve continues to fight inflation by raising interest rates, the market is growing uncertain about futures rate hikes.
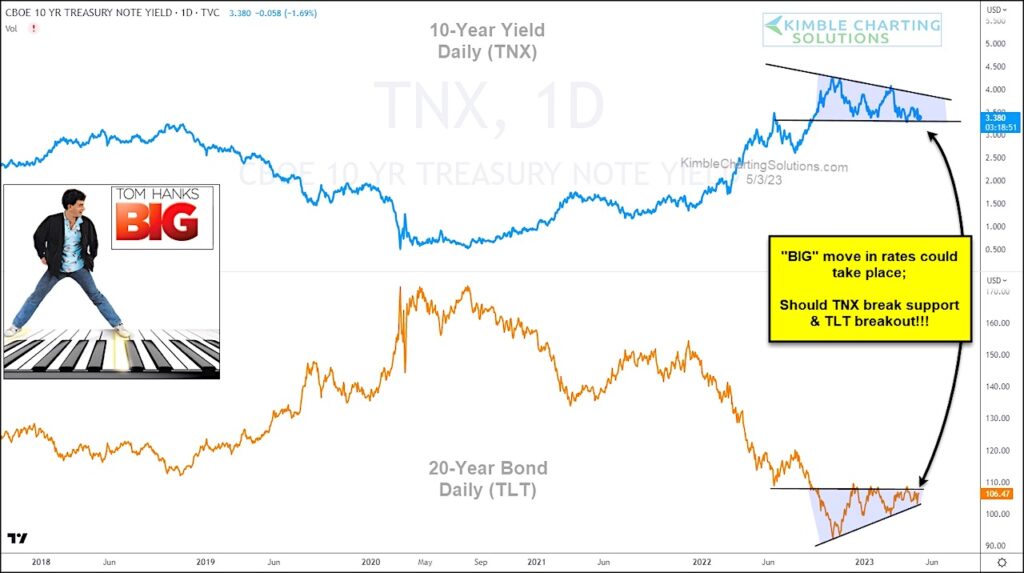
Today, we share a chart comparing the 10 year US treasury bond yield versus the popular 20+ year treasury bond ETF.
As you can see, both yields and bond prices have formed narrowing patterns… and both of these patterns are nearing completion.
If bond yields (blue) break down and bond prices (orange) breakout higher, we could see some mean reversion which would lead to lower interest rates. But if the patterns break the other way, it may mean higher interest rates.
Either way, something BIG is about to happen. Stay tuned!
10-Year US Treasury Bond Yield Chart
Note that KimbleCharting is offering a 2 week Free trial to See It Market readers. Just send me an email to services@kimblechartingsolutions.com for details to get set up.
Twitter: @KimbleCharting
Any opinions expressed herein are solely those of the author, and do not in any way represent the views or opinions of any other person or entity.


: Showing Some Signs of Emerging Strength")
