The past few months have given investors the feeling that the 3 year (monster) rally in treasury bond yields is over.
But the lull may be over. And it’s looking like bond yields (interest rates) may be rallying again.
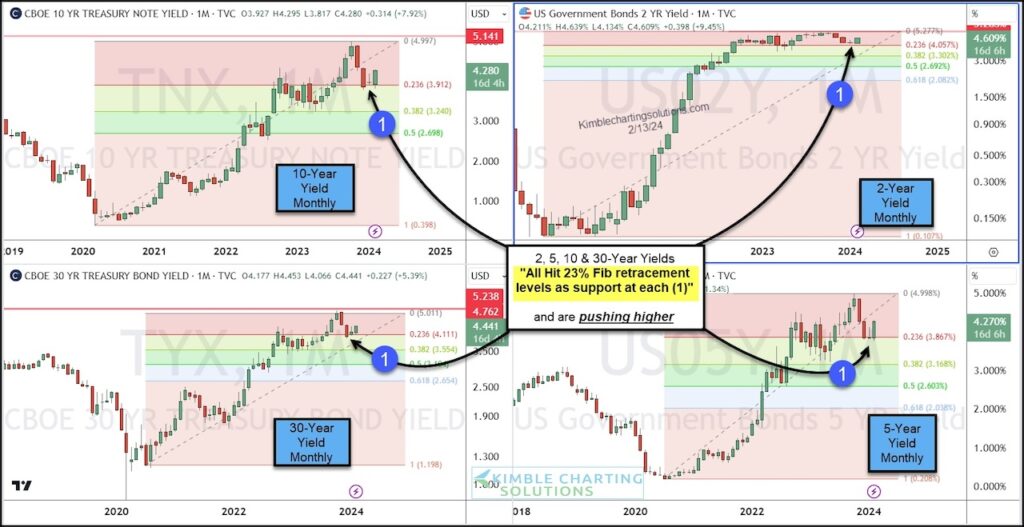
Why? Well today’s chart 4-pack looks at treasury bond yields across all time spectrums (2-year, 5-year, 10-year, and 30-year).
As you can see, whether short or long-term, ALL bond yields pulled back and tagged the 23% Fibonacci retracement level at each (1) and created monthly bullish reversal patterns.
Is this warning of higher bond yields (interest rates)? Bond prices will receive a concerning message if bond yields continue to rally off this key Fibonacci support level. Stay tuned!
2, 5, 10, and 30 Year Treasury Bond Yields Charts
Note that KimbleCharting is offering a 2 week Free trial to See It Market readers. Just send me an email to services@kimblechartingsolutions.com for details to get set up.
Twitter: @KimbleCharting
The author may have a position in mentioned securities. Any opinions expressed herein are solely those of the author, and do not in any way represent the views or opinions of any other person or entity.

: Worrisome to Broader Market?")

