Many investors seem to think that inflation is under control and interest rates are set to decline.
While this may be the longer term play, the short-term is looking a bit iffy… and active investors best keep an eye on the 10-Year Treasury Bond Yield.
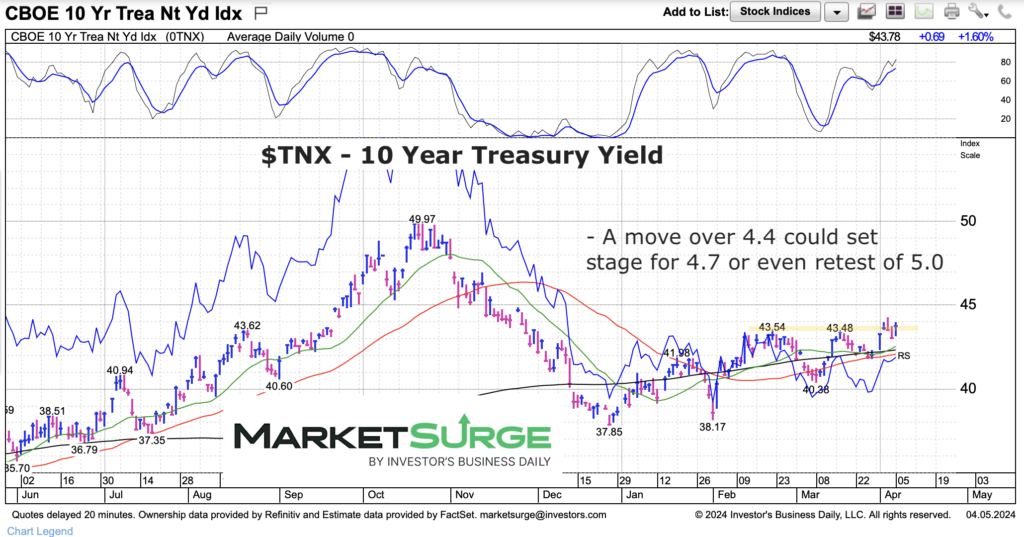
The 10-Year yield has spent the past two months trading between 4% and 4.35%. But recently that trading range has narrowed and bumped up against 4.35 a couple times.
Should rates push higher (ie. breakout), it would likely throw a temporary wrench in the timeline of many economists/investors.
Note that the following MarketSurge charts are built with Investors Business Daily’s product suite.
I am an Investors Business Daily (IBD) partner and promote the use of their products. The entire platform offers a good mix of tools, education, and technical and fundamental data.
10 Year US Treasury Bond Yield Chart
Here we can see the recent action on the 10-year yield. A breakout here could set up a run to the gap at 4.7%, and perhaps even a retest of 5.0%.
Twitter: @andrewnyquist
The author may have a position in mentioned securities at the time of publication. Any opinions expressed herein are solely those of the author, and do not in any way represent the views or opinions of any other person or entity.

: Showing Some Signs of Emerging Strength")
