Treasury bond yields (and interest rates) have been falling for so long now that investors have taken it for granted…
But bond yields have been rising for the past several months and perhaps investors should pay attention… especially as we grapple with questions about inflation and the broader economy (and prospects for recovery).
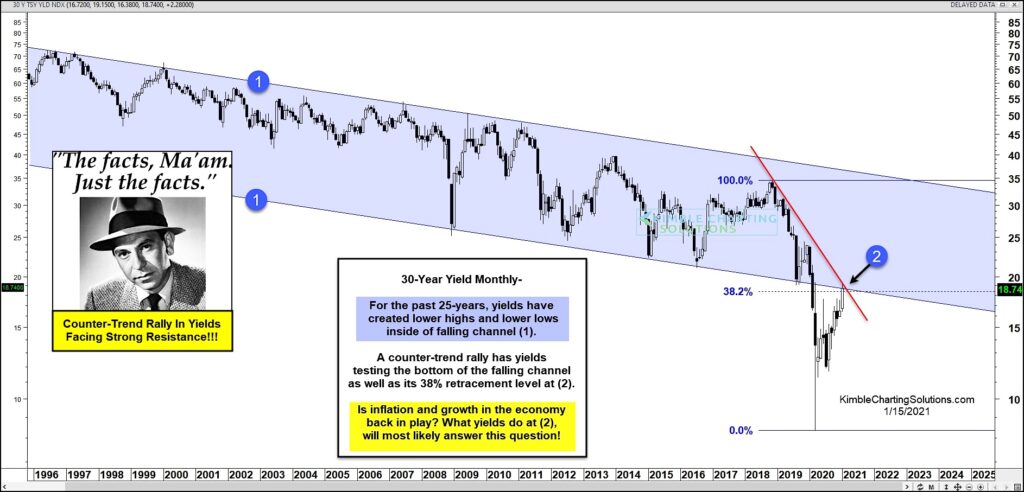
Today we ask Joe Friday to deliver us the facts! Below is a long-term “monthly” chart of the 30 Year US Treasury Bond Yield.
Counter-Trend Rally In Yields Facing Strong Resistance!
As you can see, treasury bond yields have spent much of the past 25 years trading in a falling channel… but the coronavirus crash sent yields sharply lower and out of the channel. A spike bottom took place and since then, yields have slowly been rising.
So what’s the big deal? The counter-trend rally has bond yields testing an important confluence of resistance at (2): The underside of the falling channel, its near-term downtrend line, as well as the 38.2% Fibonacci retracement level.
So Is inflation and economic growth back in play? What yields do at (2) will most likely answer this question. Stay tuned!
30-Year US Treasury Bond Yield “monthly” Chart
Note that KimbleCharting is offering a 2 week Free trial to See It Market readers. Just send me an email to services@kimblechartingsolutions.com for details to get set up.
Twitter: @KimbleCharting
Any opinions expressed herein are solely those of the author, and do not in any way represent the views or opinions of any other person or entity.


