Did I read that correctly? A right shoulder or a pork shoulder? Kind of the same thing, as it has been some time since Crude Oil bulls felt like pigs. The fall in Crude Oil prices has been well documented, so no need to remind you that every rally attempt has failed to gain traction over the past several months. Okay, I just reminded you.
Well, Crude Oil was up over 5 percent today. Check it out:
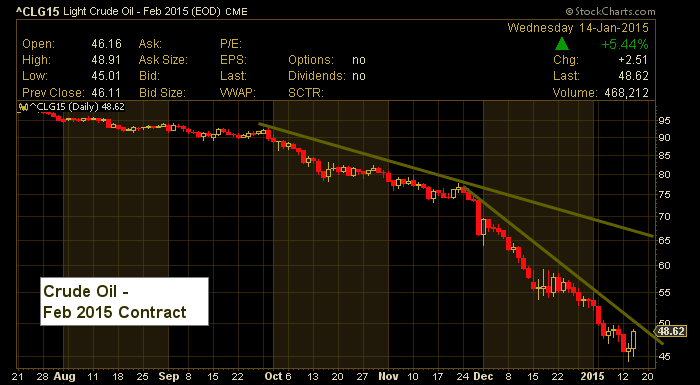
Is this time different? Well, looking at the chart above, it’s still below its near-term downtrend line and the 5 percent move higher today looks like a “blip” on the big chart. BUT, to be fair it did come after a very poor Crude Oil inventories report (showing a possible sign of near-term exhaustion). And this likely triggered some short-covering. But, the question is: Can this continue higher?
One potential trading setup (still very elusive), comes in the form of an “almost there” inverse head and shoulders pattern. This bullish pattern would come to fruition if Crude Oil holds above $46.50 and rallies back up through $49.50 and higher. See the chart below.
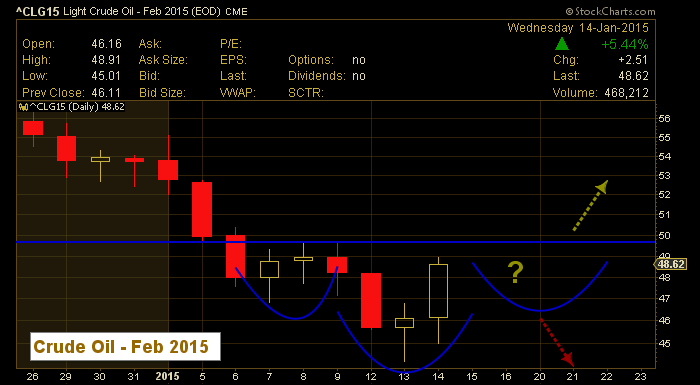
Perspective. This is simply a trading setup to monitor. It’s not actionable unless Oil breaks above $50. And even if this played out to perfection, it would simply be a “trade” that could work up to around $55/$56 (and would require a stop just under entry).
If Crude fails to go higher from here… well, you know… new lows. Trade safe.
Follow Andy on Twitter: @andrewnyquist
No position in any of the mentioned securities at the time of publication. Any opinions expressed herein are solely those of the author, and do not in any way represent the views or opinions of any other person or entity.

: Worrisome to Broader Market?")

