Context: A Simple Swing Chart
The S&P 500 (SPX) has been trading with volatility in 2018, ever since the high was achieved on January 26th.
A quick look at a 2018 chart might lead one to believe that we will see another volatility event as bulls and bears battle for control near the 200 day SMA.
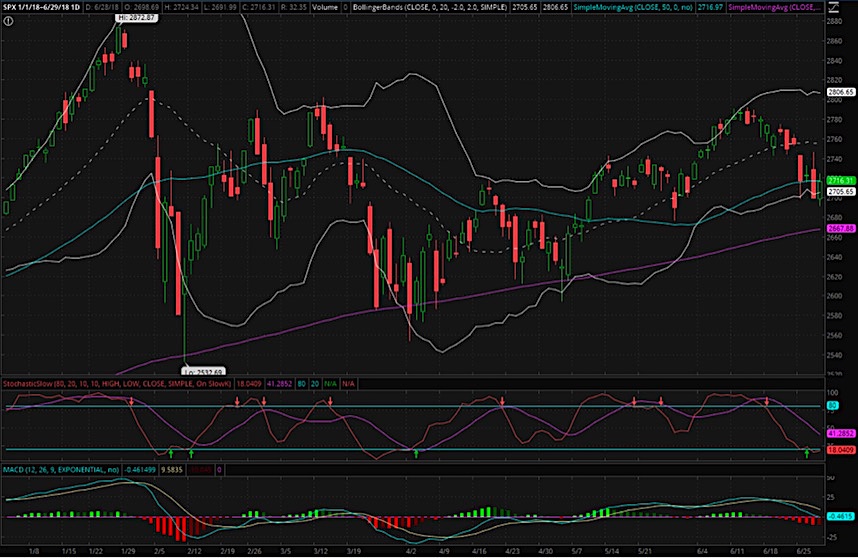
In today’s (6/28/18) session, the S&P 500 had a nice recovery into resistance at the 50-day moving average, with support found near the lower Bollinger Band. If price continues to move higher, then volatility will diminish and the stock market may begin to hibernate for the summer.
On the other hand, if the current cycle continues lower, then we could see another spike in volatility as fear and greed take center stage.
Profiting From Fear and Greed
Institutional traders know how to profit from market volatility, and the retail trader is therefore wise to not worship at the altars of fear and greed. The institutional traders often hedge their exposure with delta- and gamma-neutral options positions. On the date of option expiration, the institutional traders are often able to maximize profit and purge risk. This is why we often see volatility at or near option expiration in all asset classes.
Since the first large decline in the S&P 500 (SPX) earlier this year, we began to track the price level at which the market is delta-neutral and gamma-neutral. This data point has helped us profitably trade each of the last five option expiration dates, with both long and short positions (these trades are verifiable in our Seeking Alpha subscription service).
The chart below shows the recent history of the SPX value, graphed together with the points of delta- and gamma-neutral. Remember, the institutional traders maximize their profits by maintaining a portfolio that is Greek-neutral, so we can expect to see mean-reversion towards these price levels.
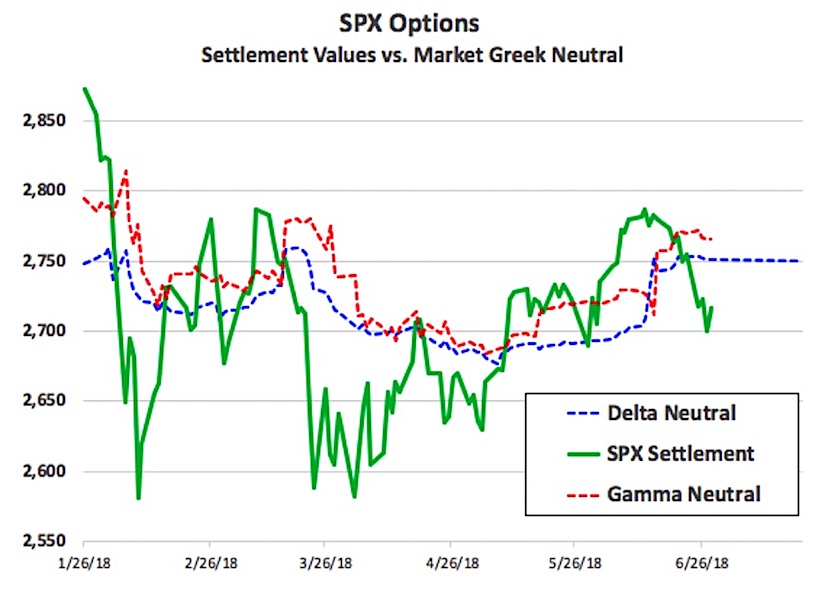
Please note also how the price level of gamma-neutral rises when the value of SPX falls. This is due to the rise in volatility, together with more puts becoming in-the-money.
Application
If the value of SPX continues to fall and market volatility increases, then there will be financial incentive for the institutional traders to see the value of SPX rise back towards delta- and gamma-neutral. As a result, we will be watching these price levels closely.
In addition, we will be following other technical and trading indicators to look for a tradeable bottom. So far this year, the best time to buy the SPX has been when volatility has spiked and with price beneath the 200 day SMA.
We wish you all the best in navigating these markets. To learn more about the Op-ex Price Magnets, please visit our website.
Twitter: @Viking_Analytix
The authors may have a position in the mentioned securities at the time of publication. Any opinions expressed herein are solely those of the author, and do not in any way represent the views or opinions of any other person or entity.


