Shares of United States Steel Corp. (X) have collapsed 81% from the 2014 highs, but is it still too early to call for a bottom in the once great steel producer?
China’s mass production rate of steel has led to “dumping” in the United States and other areas of the world, which essentially means those foreign competitors are selling below or at production costs. Tack on a stronger U.S. Dollar and you have continued downward pressure on the likes of US Steel, Nucor (NUE), AK Steel (AKS), and more.
And this could keep their respective stock prices suppressed a bit longer.
Despite tariffs levied by the U.S. Commerce Department on December 23rd, the market reacted as if the anti-dumping tariffs were less than expected. India’s 6.7% rate and no tariffs imposed on Taiwan (and others) mean many foreign company’s can continue with their controversial practices at little to no cost. These types of imports have a much greater impact on US Steel and AK Steel (80-90% of revenue). Challenging business conditions are even making US Steel rethink plans to construct an Alabama facility.
Shares of US Steel (X) trade at a price to sales ratio of 0.10x and a price to book ratio of 0.42x. Both metrics may sound like it is “cheap” on a valuation basis until you factor in the decline top line growth and the deterioration in 2015 and 2016 EPS estimates in just the last few months ($0.91 to -$1.27 in earnings for next year). Q3 earnings came in at -$0.70 on November 3rd vs Wall Street estimates of -$0.20. On December 17th, Deutsche Bank downgraded the stock to sell and lowered their price target to $5 from $13.
US Steel Corp (X) Stock Chart – Technical Analysis
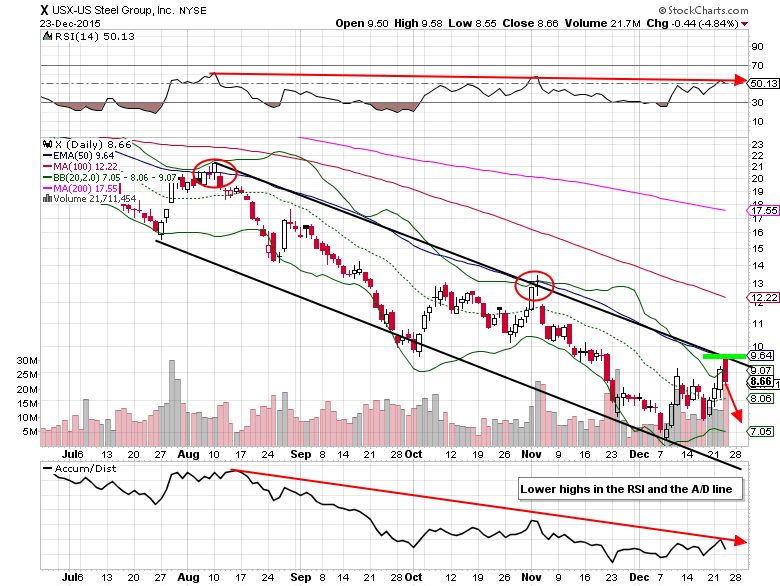
Looking at the 6-month stock chart for US Steel, you’ll notice the strong downtrending channel that is still intact. Shares of US Steel (X) gapped higher on December 23rd, initially testing the top of the range. However, by the close those gains were wiped away, closing lower by nearly 5%.
Price action like this gives traders a lower risk opportunity to take a bearish position, using a buy stop loss reference above the 50-day exponential moving average ($9.64). Look for a correction back down to the low $7’s, high $6’s over the next 1-2 months.
US Steel Options Trade Idea
One could buy the Jan 15 2016 $7/$8.50 bear put spread for a $0.50 debit or better
(This entails buying the Jan 15 2016 $8.50 put and selling the Jan 15 2016 $7 put, all in one trade)
Stop loss- None
1st upside target- $1.00
2nd upside target- $1.45
Thanks for reading.
Twitter: @MitchellKWarren
No position in any of the securities mentioned at the time of publication. Any opinions expressed herein are solely those of the author, and do not in any way represent the views or opinions of any other person or entity.


