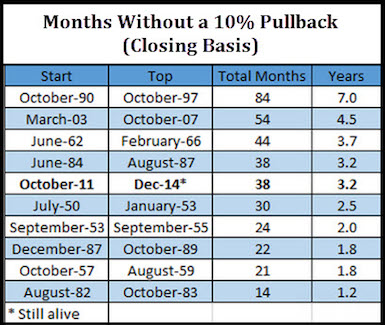
 It’s been a while since the S&P 500 (SPX – Quote) had a 10 percent correction. To be precise it’s been 38 months! (See attached table below).
As you can see, this is the 5th longest streak in the past half century.
This table also highlights that the streak of months without a 10 percent correction in the 1990’s was twice as long as the current streak.
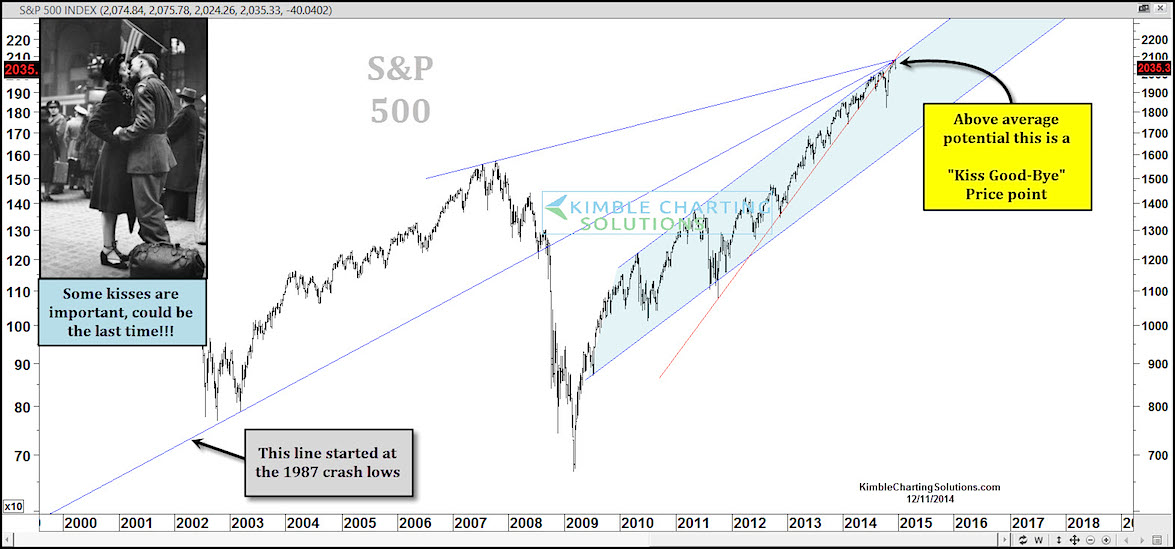
Now let’s check out a long-term chart of the S&P 500 (see below). It’s rare that 4 long-term resistance lines meet at one price point. It’s even more rare to see the S&P kissing the underside of the price point where all 4 lines meet. How the S&P handles this crossroads of resistance, could impact whether the streak without a 10 percent correction remains in play.
But this isn’t the only chart nearing long-term technical resistance. Here’s a long-term chart of the NYSE Composite:
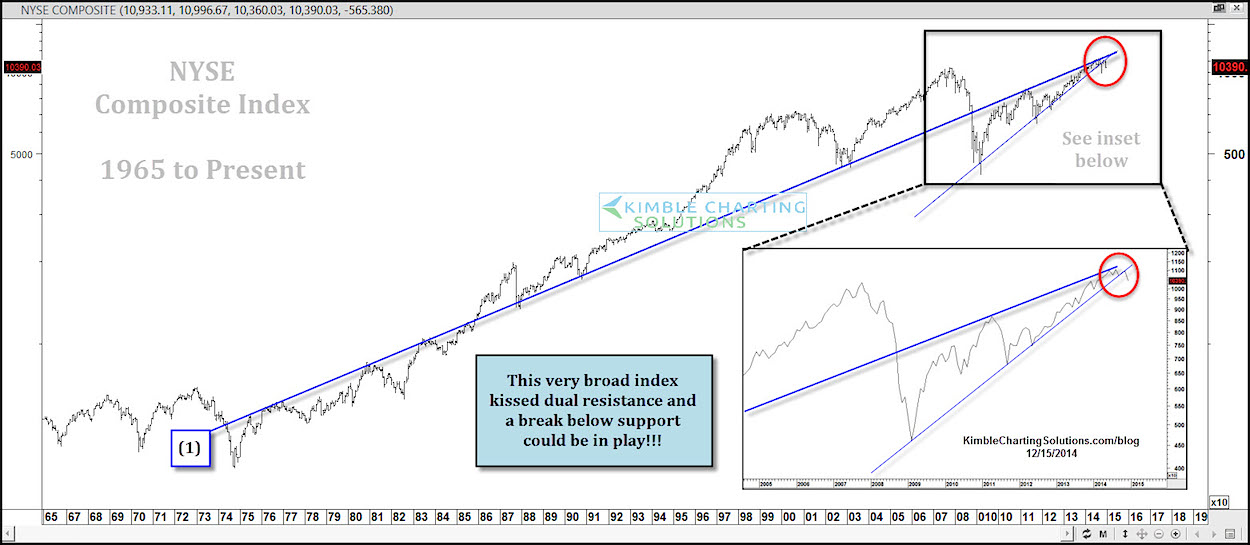
Note that the long-term support/resistance line (1) has been in play since the 1970’s as many highs and lows have tagged this line over the decades. The NYSE is hitting this line right now, for the first time since 2011. The last time it hit this line, the S&P 500 fell 15%, putting the NYSE into correction mode.
The Trend in the broad market remains up at this time (and for the past 38 months plus). However, investors will want to keep a close eye on how this very broad index handles resistance line (1). Note that its now a fraction below support of a bearish rising wedge.
When coupled with the S&P 500, we have 2 very important indexes at a technical crossroads. Odds might be low that these resistance lines can stop the current strong upward trend, yet the impact could be important to investors if it does. How price behaves here may dictate the next big move in the markets, so stay focused. Thanks for reading.
Follow Chris on Twitter: @KimbleCharting
No position in any of the mentioned securities at the time of publication. Any opinions expressed herein are solely those of the author, and do not in any way represent the views or opinions of any other person or entity.


