It’s been a decade since Gold outperformed the stock market on a steady basis.
2018-2019 was strong, but precious metals couldn’t keep the momentum going.
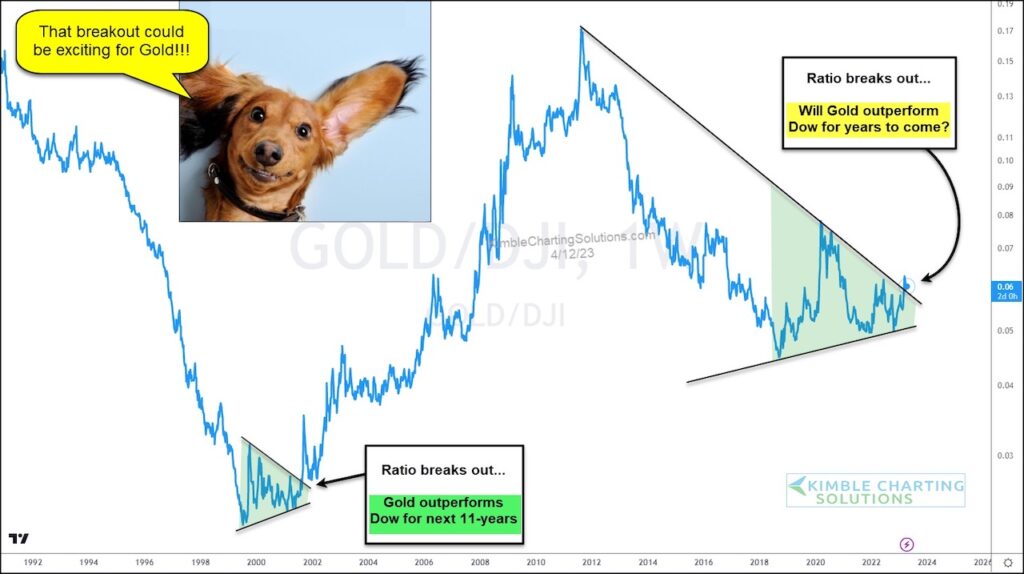
Today’s chart looks at the Gold’s relative performance based on its ratio to the Dow Jones Industrial Average.
As you can see, Gold has been in a bit of a rut since peaking over a decade ago.
HOWEVER, Gold’s outperformance this year has it breaking out above downtrend resistance within a triangle pattern.
This potential breakout in the Gold/Dow ratio is sending a positive message to Gold bulls. Will gold outperform stocks for years to come? Stay tuned!!
Gold / Dow Jones Industrials Ratio Price Chart
Note that KimbleCharting is offering a 2 week Free trial to See It Market readers. Just send me an email to services@kimblechartingsolutions.com for details to get set up.
Twitter: @KimbleCharting
Any opinions expressed herein are solely those of the author, and do not in any way represent the views or opinions of any other person or entity.

: Showing Some Signs of Emerging Strength")

