Back in March I did a comprehensive overview of the financial markets that looked at the technical setups across multiple asset classes. Fast forward five months and many trends have continued to play out with dogged determination. Nevertheless, reviewing fresh data can help us pinpoint key areas that represent opportunities or those that should be avoided.
Here are 5 Charts that active investors should be monitoring and what they are saying about the current state of the financial markets.
Stocks – Home On The Range
Looking at a chart of the SPDR S&P 500 ETF (SPY), the most obvious pattern is the 5% range that this index has traded in since early February. The key delineation on both sides of this consolidation phase is a low of 202.50 and a high of 212.50.
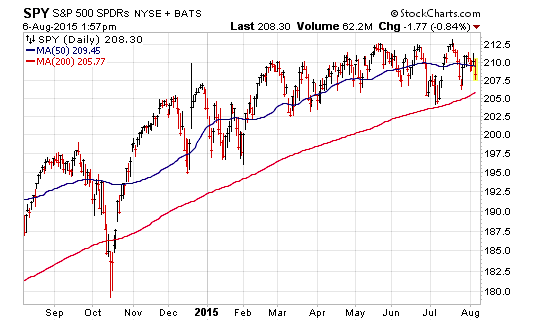
SPY has gained just 2% so far this year despite multiple false starts in both directions. Right now it is sitting in the middle of this range and many traders are trying to anticipate the next big move in stocks. While it may seem that volatility and sentiment swing to fast extremes, the overall price movement has been comparatively mild.
My advice is to continue to use established price patterns to your advantage until we see a confirmed break in either direction.
Bonds – Back To The Starting Line
Aggregate bond indexes such as the Vanguard Total Bond Market ETF (BND) have been on a wild ride this year. After peaking in early January, fears over a Federal Reserve rate hike pushed BND into negative territory for 2015. Over the last two months we have seen some stabilization in price that has essentially leveled the index back to the flat line.
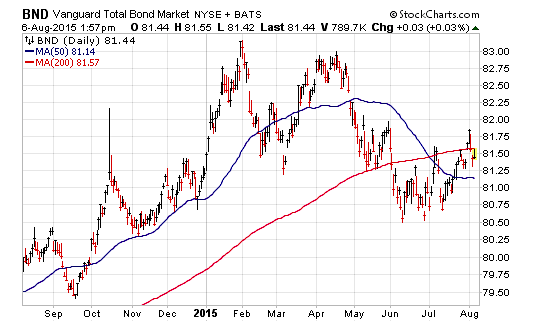
The question now becomes, where do we go from here?
My gut feeling is that bonds are going to continue to be a very important asset class to own even during a brief period of monetary policy tightening. The cushioning effect that they provide is essential in the context of a well-balanced portfolio.
However, I would advise investors to closely monitor how their bond ETFs and mutual funds react compared to a broad-based index. More credit sensitive holdings may see heightened volatility than diversified or multi-sector portfolios.
Commodities – The Song Remains The Same
The chart of the PowerShares DB Commodity Index Tracking Fund (DBC) says it all. Commodity prices are in a persistent downtrend and bear market that has yet to find a bottom. I have been recommending that investors avoid this space for some time and there doesn’t seem to be any evidence supporting a change to that tune.
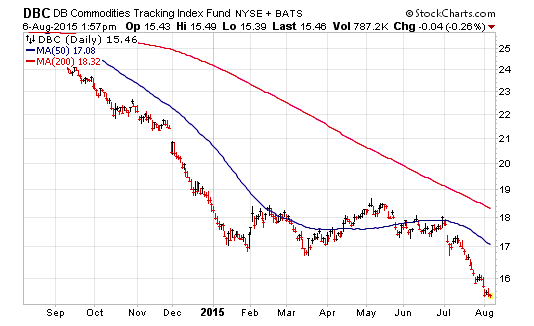
Many financial markets watchers are obsessed with trying to figure out the reason for the commodity slump. Rather than focusing on complex macro factors or other economic machinations, simply take comfort in the indisputable fact that there are more sellers than buyers. Price tells us everything we need to know about gold, silver, oil, agriculture, and industrial metals.
Currencies – U.S. Dollar Uptrend Intact
The obsession with currency hedging and U.S. dollar strength has cooled off somewhat in financial circles, yet the overall trend shows a continued bias to the upside. The PowerShares DB U.S. Dollar Bullish Fund (UUP) is up nearly 7% this year, and despite taking a breather from its highs, has continued to march above its long-term moving average.
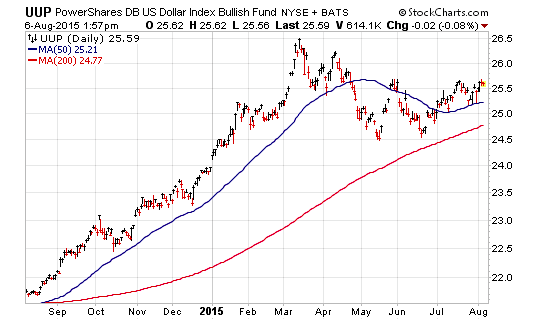
The line in the sand for this index is the 24.50 level that it tested in both May and June of this year. A break below that level may ultimately derail the strength in the U.S. dollar and prop up both the euro and yen currencies… as well as have an effect on the broader financial markets.
Volatility – Mind The VIX
An interesting pattern has emerged in the CBOE VIX Volatility Index (VIX) – every time this index probes below 12, we seem to see a downward thrust in stocks. For traders with a short-term mindset, or those that are looking to put money to work at opportunistic entry points, pay close attention to the VIX reading. It can be a solid counter-intuitive tool for evaluating market sentiment.
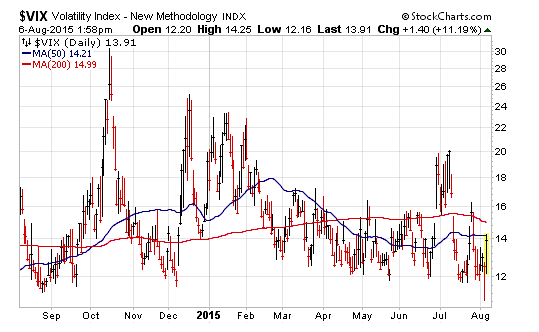
Earlier this year, I wrote that we would likely see an uptick in volatility across the financial markets as compared to 2014. That theme has certainly proven to be true, yet this has also been a guide for savvy investors that look for areas to add or reduce exposure to stocks.
I still recommend staying away from VIX-related vehicles such as the iPath S&P 500 VIX Short-Term Futures ETN (VXX) for anyone other than the most aggressive traders. The structure of these products has proven to be inefficient for anything more than VERY short-term trades with defined risk management guides in place.
Gather more insights from David’s investment blog.
Twitter: @fabiancapital
No position in any of the securities mentioned at the time of publication. Any opinions expressed herein are solely those of the author, and do not in any way represent the views or opinions of any other person or entity.


: Showing Some Signs of Emerging Strength")
