The switch has flipped. Bulls are struggling to figure out what they are bullish about, while bears know exactly what they are bearish about. That is a polar opposite versus 3 to 4 months ago and the broader view of the preceding 5 years. Don’t fight the fed and don’t fight the trend are en vogue for clueless drone traders and managers.
With each new low in the Dow Jones Transportation Average there are a handful of new commentators explaining why it doesn’t matter. Okay, think about it for a minute: Remember the countless bullish occurrences in the market over the last 5 years where scores of market pundits lined up to to tell you why they didn’t matter. At the same time, that doesn’t mean they’ll be wrong – just that we need to realize that they don’t matter until they do.
@millenial_inv ponders: Is it now smart to be stupid? It might just be the next few months. We look at the various divergences in breadth, Dow Theory and some recession-esque economic data and they are all collective warning signs that can lead the market for quite some time.
The issue with thinking things can continue like this for some time is the 1.618 fib extension level from the 2007-2009 range (the 2138 S&P 500 level) I continuously mention. If you are a Fibonaccian – this is pretty close to ”an ultimate test’. A Golden Ratio extension coming off the most important range of the last generation in the world’s most renowned stock index. One would think we would at least see a pullback with deteriorating breadth and fundamentals from somewhere around this level.
S&P 500 Fibonacci Extension Levels
If this 2140 area in the S&P 500 is taken out, we are going to add a few more plays to the chaser’s playbook.
It’s worth repeating that regardless of the broad market, short term traders with a focus on the upside are making the most money. Barring a massive market event, odds are that can continue in June.
Okay, now for some charts as we look ahead to next week.
Fear is at the top of the recent range. This suggests we’ve seen no shift in environment even though the bulls have loosened their grip short term.
Volatility Index Ratio vs S&P 500
Sector Review
It’s really a bummer to be missing the trade in the Semiconductors. The leaders in mobile computing, data center and the “internet of everything” have done an incredible job separating themselves from the group in 2015.
It’s so hard to short single stocks. M&A risk continue at a multi year highs. The financing for deals is available and, more importantly, growth is becoming increasingly scarce.
Buyouts are taking over the space at 52 week highs. Interestingly, The Semiconductor Index (SOX) relative strength has lagged recent highs.
SOX Semiconductor Index
The Biotech Sector ETF (IBB) has stalled like the rest of the market. It will be interesting to see what comes out of the big cancer conference which ends on Tuesday.
Biotech Sector ETF (IBB) Chart
The Financials Sector (IYF) are at the heart of the ‘I don’t know why i’m bullish, but buy ’em cause the Fed’ epidemic. Is this multi year laggard going to start leading? Or will this prove to be a false breakout? This could be the opportunity of the year to short financials with limited risk.
IYF Financials ETF Chart
Oh by the way, the TED spread is rising every day and at 2 and a half year highs.
TED Spread Chart
A Look Around The World
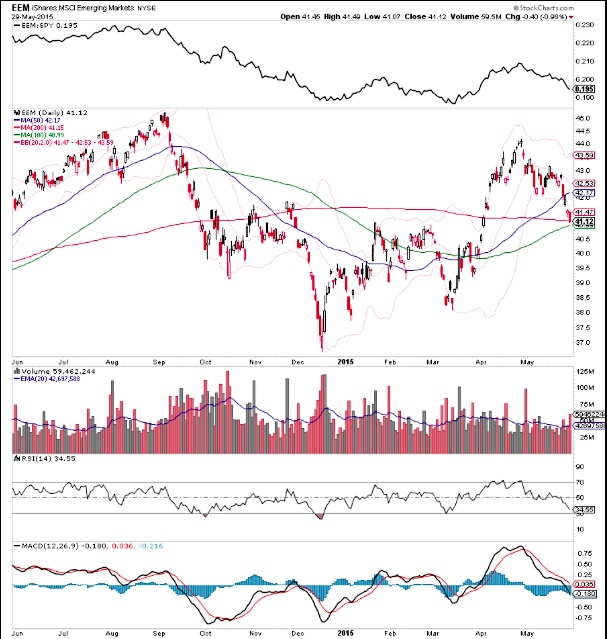
Emerging Markets ETF (EEM) is persisting below the lower Bollinger band as they approach the 100/200 day moving average combo.
EEM Emerging Markets ETF Chart
Can the S&P 500 break away from it’s 2015 downtrend relative to the rest of the world? That’ll be a key with the damage picking up in China, other emerging markets and Europe.
S&P 500 vs Global Market Index (ACWI) Chart
Have a great week.
Follow Aaron on Twitter: @ATMcharts
Read more from Aaron on his blog.
No position in any of the mentioned securities at the time of publication. Any opinions expressed herein are solely those of the author, and do not in any way represent the views or opinions of any other person or entity.

: Cup (and Maybe Handle) Watch")
 Trading Near Top Of Price Range")

