As I have noted in past articles, Tom DeMark has always insisted in using the current active contract when overlaying his indicators on commodity futures. The problem is that for contract such as crude oil for example, the trading history of the active contract does not go back far enough to look at the indicators in monthly or even weekly timeframes. For that, one is limited to using the prices from the “continuous contract”.
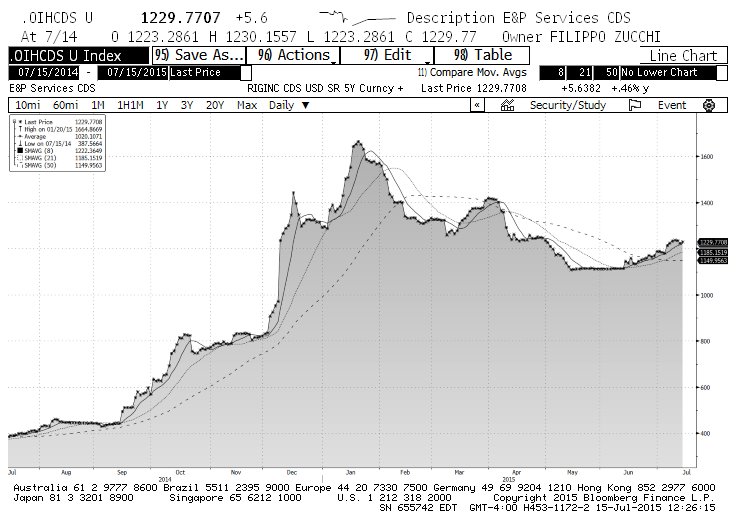
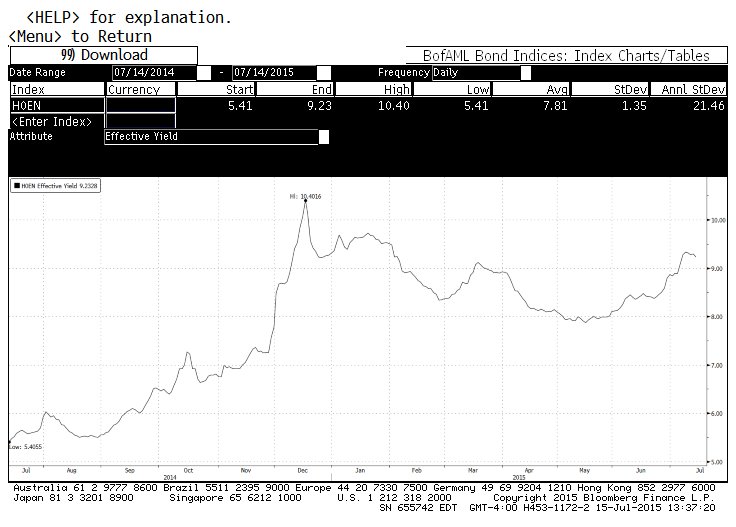
With that caveat, I would like to provide a quick update to a piece I wrote back in April on the Energy Sector and Crude Oil: “Flickering Hope In The Energy Sector“. After a tightening that coincided with the now-fading Crude Oil rally, both energy sensitive Credit Default Swaps and – especially – High Yield energy spreads have again widened. For a sector particularly reliant on credit for its operations, this is a major red flag.
Oil Services (OIH) Credit Default Swaps
High Yield Energy Spreads
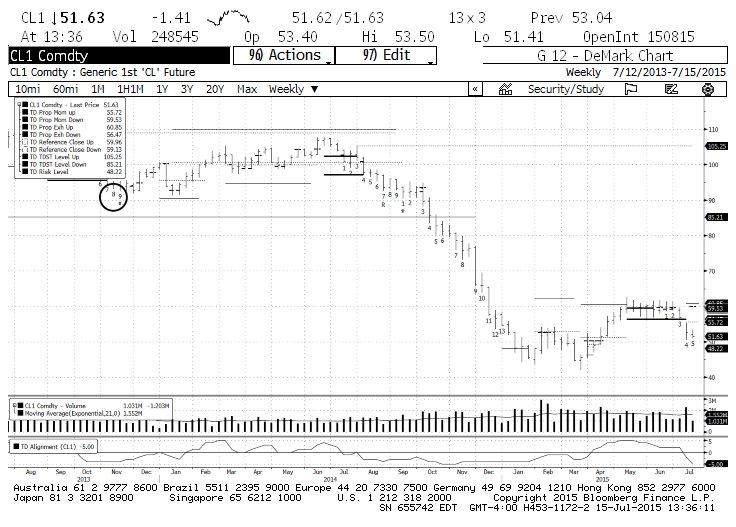
Meanwhile, the DeMark counts are back to being quite bearish. On the weekly chart of the continuous contract for Crude Oil (CL1) the TD Buy Setup is on bar 5 of 9. But the real “bear” is in the monthly chart, which shows only bar 1 of the Sequential Countdown Buy. Given that the TDST Level Down line is broken on a “qualified” basis, the Sequential Countdown Buy 13 is presumed to complete, which suggests a lot lower prices for Crude Oil. The only thing that could invalidate that presumption is if the current TD Sell Setup, now on bar 4, also completes.
Crude Oil Prices (CL1) Weekly Chart
Crude Oil Prices (CL1) Monthly Chart
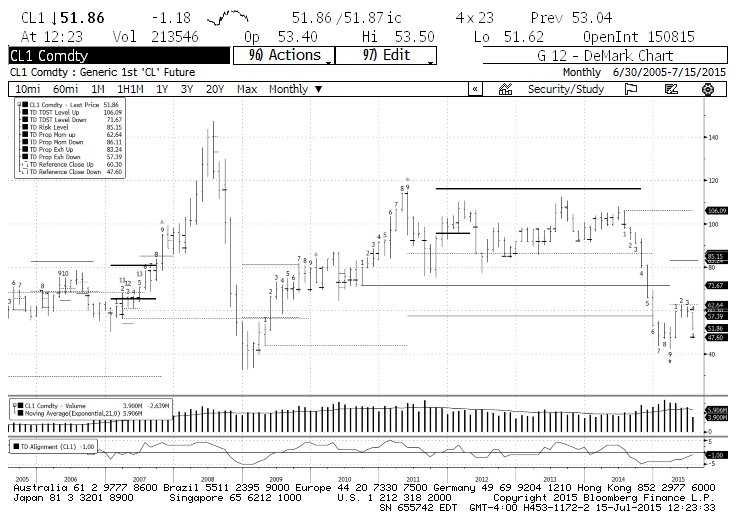
As for how low the price could go, the monthly TD Relative Retracement suggests that it could be all the way down to a scary $12.
In the last paragraph of the April article I argued that unless energy got itself off the mat like it meant it, the budding rally was going to be just a countertrend rally in a secular bear move. And unless things change radically sooner than later, that scenario is looking more and more likely.
Thanks for reading and good luck out there.
Twitter: @FZucchi
Any opinions expressed herein are solely those of the author, and do not in any way represent the views or opinions of any other person or entity.


