The chart of the S&P 500 Futures (ES_F) is approaching a prior high from premarket on last Thursday under negative divergence. This is usually a formation that shows a high likelihood of level rejection rather than a breach and hold to higher levels. Markets should be awaiting an FOMC rate increase and watching the ripples from an ECB stimulus package. The day appears to be setting up for a press higher then a rejection based on momentum, but buying support remains strong at key levels.
Near term support for S&P 500 futures now lies beneath near 2080.5 region and near term resistance near 2098 region. Breaches are likely to fail and retest before continuing due to divergent momentum readings. Steep pullbacks remain buy zones rather than breakdowns unless there are news events that make the markets particularly nervous.
Shorter time frame momentum indicators are bullish, but lower than Friday.Longer cycles are still bullish, but momentum is tepid at best. All indicators on longer time frames at this point show buyers still in charge, but their strength is not aggressive.
Click here for an economic calendar with a rundown of releases.
RANGE OF MONDAY’S MOTION
Crude Oil (CL_F)
Oil is back at the familiar support level near 42.2 -42.4. Secondary support zone remains near 41.6. The breakout region is still 42.54 for the upside and 41.58 for the downside today. A hold and retest of 42.54 sends us near 42.8, then 43.3 (as we saw on Tuesday and Thursday of last week), and perhaps into 44 if the range expands. Breakdown below 41.58 sends us back to 40.79 and perhaps lower to 40.14, and 39.9. Momentum on short time frames is mixed. See premium blog for tighter levels.
S&P 500 Futures (ES_F)
Chart Key Levels For The Week
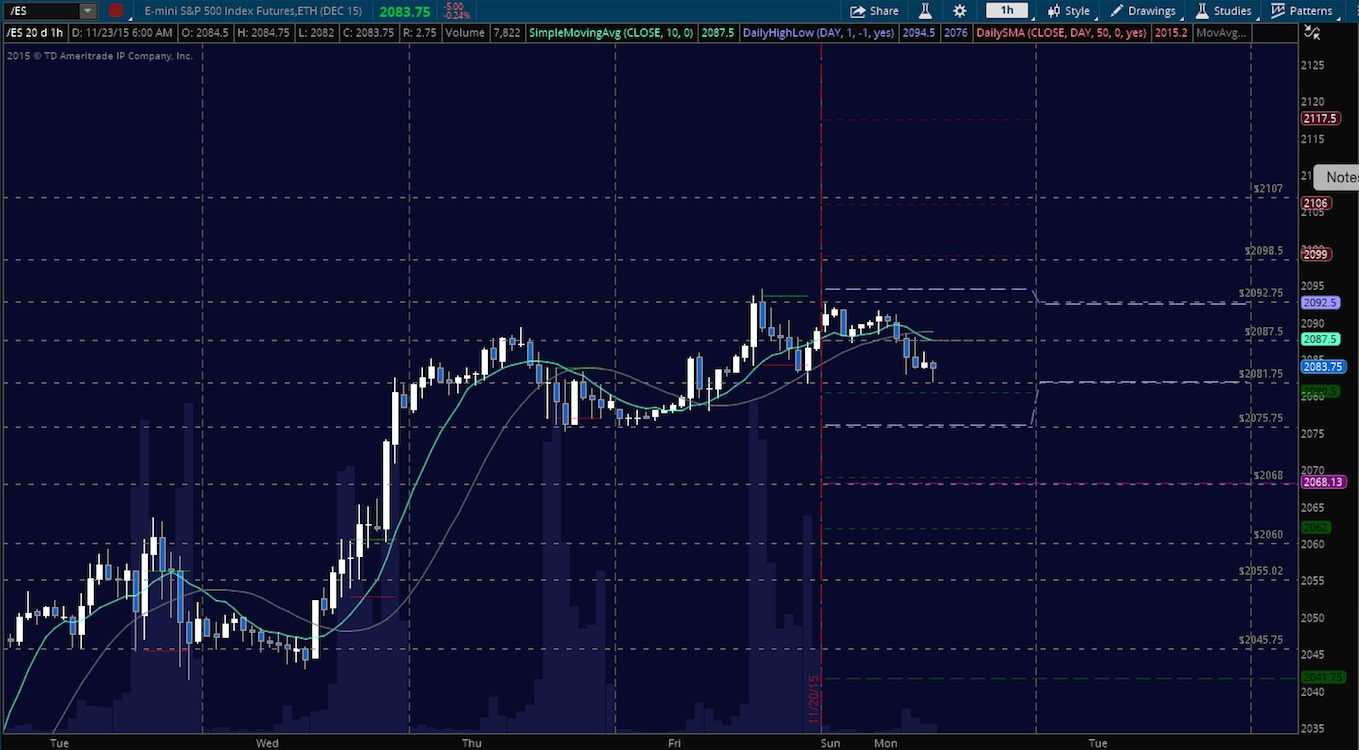
Upside motion is best setup on the bounce off the support line near 2089.5. Congestion support lies at 2085. If the buyers have limited power, the chart will fail to breach and hold 2098.75. Momentum is bullish on tighter time frames, but divergent on larger frames of reference. A hold of 2089.75 should deliver 2092.5, then 2094.75, 2096.25, 2098.25, and with a breach potentially 2099.25, and 2100.25 as targets. The breakout should not initially hold. For big motion outside this level, or other intermediate levels, see the blog post in the Platinum Level protected area.
Downside motion below the failed retest of 2089, or at the failure to hold 2098.25 (watch momentum- that would be aggressive as it get to interim higher highs) opens a short. [BIG PICTURE NOTE => Short trades should be staged into support and then cautiously watched after some profit is taken, until we fail 2045 on a retest- that level represents a very strong buying support zone and will keep the chart essentially bullish on larger time frames.] Buyers are still in charge, though patterns look very tired. Retracement of S&P 500 futures into lower levels from 2089 will give us the targets at 2086.75, 2083.5, then 2081.25, 2080.5, 2076.75.
If you’re interested in the live trading room, it is now primarily futures content, though we do track heavily traded stocks and their likely daily trajectories as well – we begin at 9am with a morning report and likely chart movements along with trade setups for the day.
As long as the trader keeps himself aware of S&P 500 futures support and resistance levels, risk can be very adequately managed to play in either direction as bottom picking remains a behavior pattern that is developing with value buyers and speculative traders.
Visit The Trading Vault and SMB Capital to learn how to trade the way I do. Thanks for reading.
Twitter: @AnneMarieTrades
Any opinions expressed herein are solely those of the author, and do not in any way represent the views or opinions of any other person or entity.


