Happy Friday. It’s time to look at the futures and some S&P 500 trading levels for today.
The S&P 500 futures (ES_F) chart rolled over and fell right into the key support level I had been speaking about for a while at 2045. The chart is now caught in a bit of a trading range, with various S&P 500 trading levels in between. With the jobs numbers out, and the FOMC decision next week, we’re sure to see more fireworks in some form with eyes on whether the chart holds 2045 by day’s end.
The charts seem to be at an important support zone and S&P 500 trading level.
Near term support still lies beneath near 2045 region and near term resistance near 2068.25 region. Because we are under tepid momentum readings, breaches on either side of those levels should test and return to their breach levels before continuation. Steep pullbacks remain buy zones in these formations as buyers continue to exert more control. Watch for the lower highs as a tell tale sign of exhaustion.
Short time frame momentum indicators are mixed, and lower than Thursday. Longer cycles are flattening but still in bullish territory, but momentum is weakening upside. Decision zone in the charts.
See today’s economic calendar with a rundown of releases.
RANGE OF FRIDAY’S MOTION
Crude Oil (CL_F)
The buy zone for crude oil continues to be near the 40 level, and is bouncing off support. OPEC meetings about to be over and news should begin to pour out. Chances are very slim that there will be production cuts. Secondary support zone is near 39.8. For an intraday trading formation, we see a range event between 41.05 and 41.60 today. A breach and retest of these levels on either side will create an expansion of price based on the formation. Oil traders are still skittish and uncertain. Above a 41.65 retest sends us near 41.9, then 42.2 and 42.78. Below a 41.35 retest sends us to 41.1, 40.8, 40.65, 40.35, and 40.1. Momentum on short time frames is negative.
S&P 500 Futures (ES_F)
Chart With Key S&P 500 Trading Levels For This Week
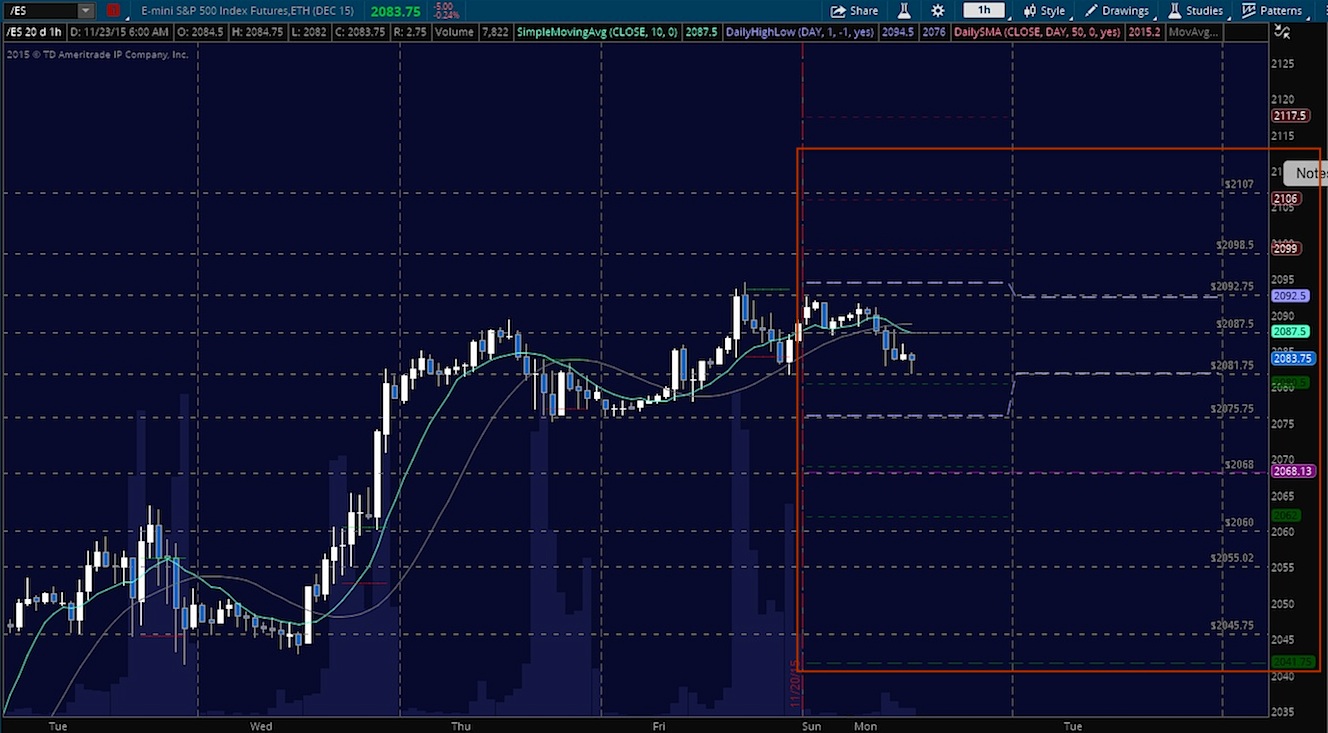
Upside motion is best setup on the bounce off the support line near 2053.25, or a retest of 2062.75. If the buyers have limited power, the chart will fail to breach and hold 2068.75. A hold of 2062.75 should deliver 2065.25, 2068.25, then 2071.25, 2073.25.
Downside motion below the failed retest of 2060.5, or at the failure to hold 2068 opens a short (watch momentum on tight time frames- that would be an aggressive short). [BIG PICTURE NOTE => Short trades should be staged into support and then cautiously watched after some profit is taken, until we fail 2045 on a retest- that level represents a very strong buying support zone and will keep the chart essentially bullish on larger time frames.] Buyers are being tested- patterns look very tired. Retracement into lower S&P 500 trading levels from 2060.25 give us the targets at 2058.75, 2056.5, 2053.25, then 2051.25, 2048.75, 2045.25. Expansion levels can be found in the Platinum Level protected content.
If you’re interested in the live trading room, it is now primarily futures content, though we do track heavily traded stocks and their likely daily trajectories as well – we begin at 9am with a morning report and likely chart movements along with trade setups for the day.
As long as a trader keeps themselves aware of key S&P 500 support and resistance levels, risk can be very adequately managed to play in either direction as bottom picking remains a behavior pattern that is developing with value buyers and speculative traders.
You can visit The Trading Vault to learn how to trade the way I do. Thanks for reading.
Twitter: @AnneMarieTrades
Any opinions expressed herein are solely those of the author, and do not in any way represent the views or opinions of any other person or entity.


