Canada legalized recreational pot / cannabis.
Mexico is working on legalization.
That would put the U.S. literally bordered by legalized pot.
Whether the U.S. follows in kind on cannabis, remains to be seen.
But for now, 33 states have legal medical pot, while 10 states have legal recreational pot.
Clearly, the megatrend in infancy, is wearing pull-up diapers.
But, what about pot / cannabis stocks and the popular marijuana ETF (NYSEARCA: MJ)?
With the big down move in the stock market today, the popular marijuana / cannabis ETF (MJ) went green.
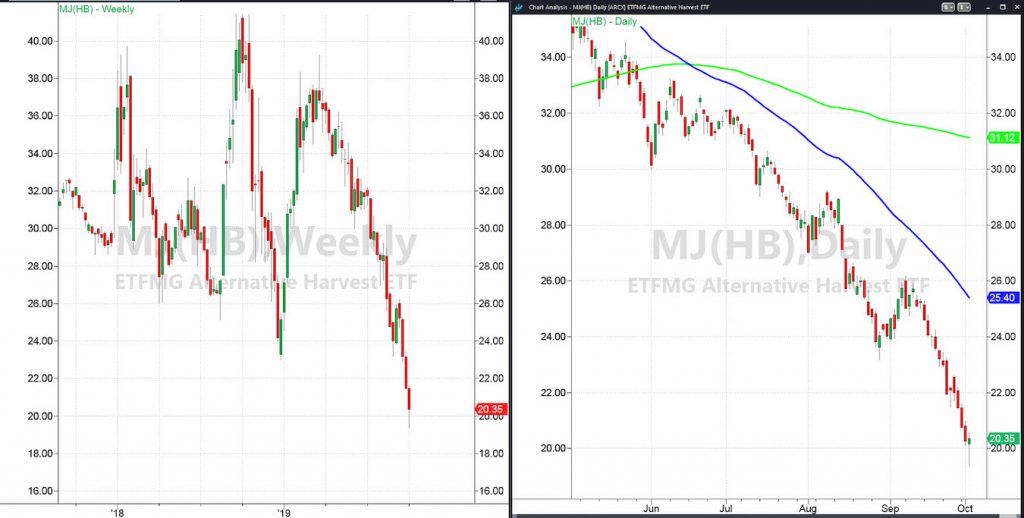
The day began with MJ making a new all-time low at 19.36. Had the low been 19.33 it would have matched the year alcohol prohibition ended. Oh well.
Nevertheless, MJ found buyers or bottom pickers.
This is not the first time though.
If you look at the daily chart on the right, the last successful attempt at a bottom happened on Christmas eve day 2018.
Santa bought CBD infused cookies and milk as the ETF rallied from 23.00, to a peak of 39.00 in March 2019.
The volume on the run up was light, while the biggest volume days were at the peak highs and ensuing sell offs.
So, with today’s double the average daily volume, we do wonder if this time, the bottom is really in.
I like that the price closed above yesterday’s low at 20.09.
On the weekly chart, I’d feel better if MJ can close above last week’s low 21.40.
However, in the meantime, should MJ hold around 20.00 tomorrow, this time could be even better than the December low.
One major difference is that in December, the overall market got the Powell bump and rallied. Now, we are in the midst of a correction.
Therefore, one must also respect the macro trend. The S&P 500, still in a bullish phase on the weekly chart, must stabilize at the very least.
S&P 500 (SPY) 283.41 the 200-DMA with 286.77 a weekly EMA support level. Left a gap down today-like to see that filled.
Russell 2000 (IWM) 146 the September low now pivotal. 144.25 August low if that fails and like SPY has a gap to fill if good at 150.79
Dow Jones Industrials (DIA) 258.47 the 200-DMA-also still in a bullish phase on the weekly chart.
Nasdaq (QQQ) This did fill the gap and is also in a bullish phase on the weekly chart. 180 major support, 186 pivotal and 189 resistance.
KRE (Regional Banks) 51.84 the 50-DMA resistance with 50.00 support.
SMH (Semiconductors) Incredibly, this held the 50-DMA at 116.33-so that is the key-and if the market runs, go here.
IYT (Transportation) 174.26 the August low. Needs to fill the gap as well to 181.08
IBB (Biotechnology) Remember 97.00. It’s the monthly MA this must hold by the end of October. Otherwise, IBB breaks a 10-year uptrend.
XRT (Retail) 41.10 the 50 DMA for this to clear with support around 40.00
Twitter: @marketminute
The author may have a position in the mentioned securities at the time of publication. Any opinions expressed herein are solely those of the author, and do not in any way represent the views or opinions of any other person or entity.

 Flirting With Critical Support… Again")


