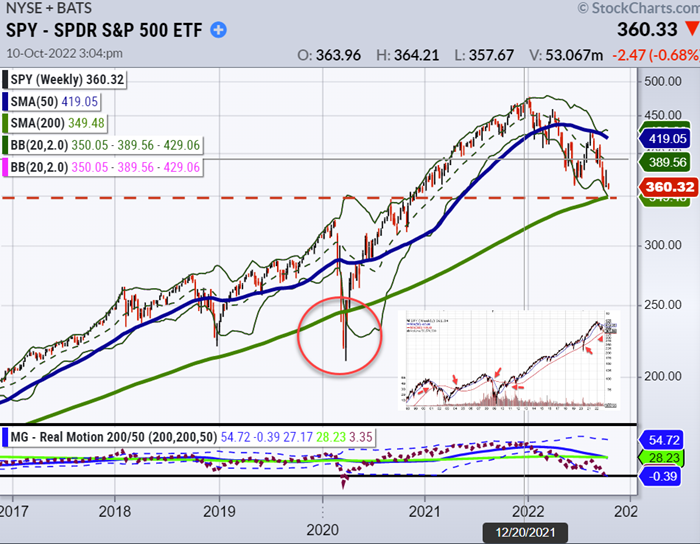
The S&P 500, represented by the ticker SPY, has generally stayed above the 200-week moving average long-term. It is a good line in the sand to use as a guide for potential market crashes.
Bear market declines are primarily responsible for the few occasions when the SPY dipped to or below the 200-WMA — most notably in 2001, 2009, and 2020.
Due to the devaluation of US debt, the SPY also temporarily breached the 200-WMA in 2011.
The adage “Don’t fight the Fed” was repeated by Mish recently to remind our team that the Fed is aggressively tightening into a slowing economy with high inflation and a tight labor market.
The stock market is on a collision course, but based on past seasonal trends since 1946, we might not want to “Fight the mid-term elections.”
The seasonal pattern of stock prices during mid-term election years points to an anticipated pattern.
What will the SPY’s 200-week moving average tell us about the likelihood of more market falls and the plausibility of the normal mid-term election stock market pattern materializing in the coming weeks?
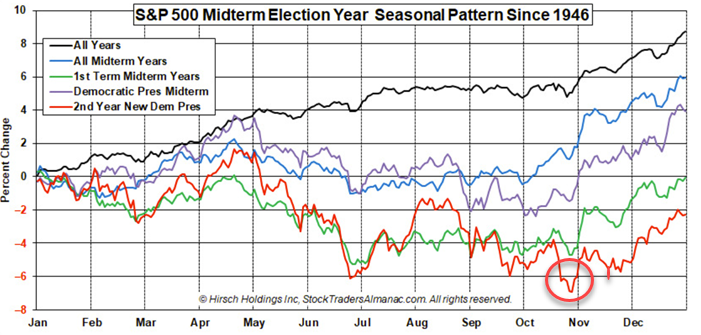
During mid-term election years since 1946, there is bias to the downside from mid-October to early November, but a strong rebound is generally seen.
The chart above, “S&P 500 Midterm Election Year Seasonal Pattern Since 1946,” points to lower stock prices in mid to late October, with a rebound in November lasting through the end of the year.
Please note the red line above represents the 2nd Year of a New Democrat elected President.
Historical seasonal patterns since 1946 around mid-term elections point in a particular direction, but that does not mean this year will follow the past seasonal direction.
With the market in such a bearish mode, it may be hard to have confidence in this bullish seasonal pattern established since 1946.
Will this year deviate from the mid-term election seasonal pattern?
For specific confirmation and signaling, we will look at the 200-weekly moving average in the SPY, XRT, IYT, and IWM and keep our subscribers closely informed.
The SPY and Mish’s Modern Family could signal an increased sell-off in the upcoming days and equally alert us to a potential seasonal trend change in the weeks ahead, which could lead to a profitable 4th quarter for those prepared.
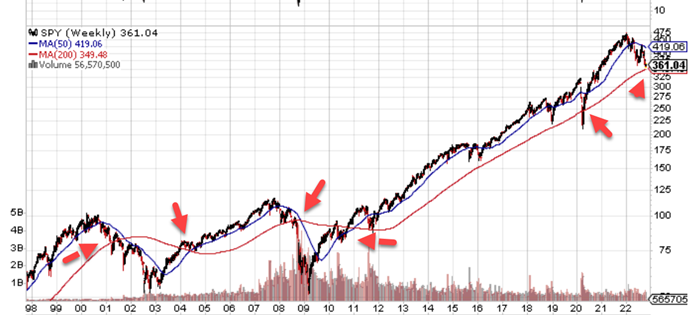
SPY – SPDR S&P 500 Trust ETF (1998-2022)
The 200-week moving average history
Subscribe to Mish’s Daily for additional market insights and stay up to date on the Modern Economic Family’s next market moves. You don’t want to be caught in a market crash – or miss out on potential profits.
Stock Market ETFs Trading Analysis & Summary:
S&P 500 (SPY) 358 support and 365 resistance
Please note previous first level of support listed on Friday, October 7, 2022, was 371 and Friday’s high was 373 before closing at 362.79.
High of the SPY on Monday was 363.96 and the low was 360.44
Russell 2000 (IWM) 166 support and 171 resistance
Dow (DIA) 290 support and 296 resistance
Nasdaq (QQQ) 263 support and 269 resistance
266 support and 272 resistance were the past trading levels and sold off on Monday near support at 266.41.
KRE (Regional Banks) 59.22 is support and 61.70 resistance
We had listed support at 60.30 for Friday and sold off to 60.34 on Friday’s close and closed on Monday at 60.21
SMH (Semiconductors) 180 support and 185 resistance
IYT (Transportation) 196 support and 203 resistance
IBB (Biotechnology) 116.59 is now support and 120 resistance
We had listed support at 119.32 on Friday and sold off to 118.84 on Friday’s close right around first level of support and closed at 117.95 on Monday.
XRT (Retail) 57 is now support and 60 is resistance
We had listed support at 58.38 and sold off to 58.26 on Friday around first level of support. XRT closed at 57.99 on Monday.
Twitter: @marketminute
The author may have a position in mentioned securities at the time of publication. Any opinions expressed herein are solely those of the author and do not represent the views or opinions of any other person or entity.


